
Capacity Statistics - Sept 2022
The air cargo capacity statistics report of September 2022 is ready with the key facts and figures of inter-regions and intra-regions in comparison to the previous month. CargoINTEL provides you with the real-time market and industry intelligence data, to empower you to make informed decisions.
Highlights
- The overall global capacity has been seen reducing in September 2022 by 6% vis-à-vis August 2022. This can be attributed to the downward shift of air cargo volumes after the first quarter of the year, subsequently affecting the operational capacity. The overall chargeable weight is also reported to be down by 12% YoY.
- The industry is going through a rampant phase that is causing fluctuation in air cargo volumes and capacity. The major reasons are the ones pertaining since the past few months like the geopolitical unrest; increasing fuel prices; inflation in major economies affecting house-hold budgets; staff shortage in airlines and airports; airport congestions mainly in Europe; easing of several lanes in ocean freight making it the first choice.
- The global freighter capacity has remained stable in September as compared to August which is indicative of the reducing worldwide air freight rates, despite the increasing fuel prices, making operation of freighters sustainable for air carriers. As per WACD, the global rates are 10% below the average rates recorded during the same time last year.
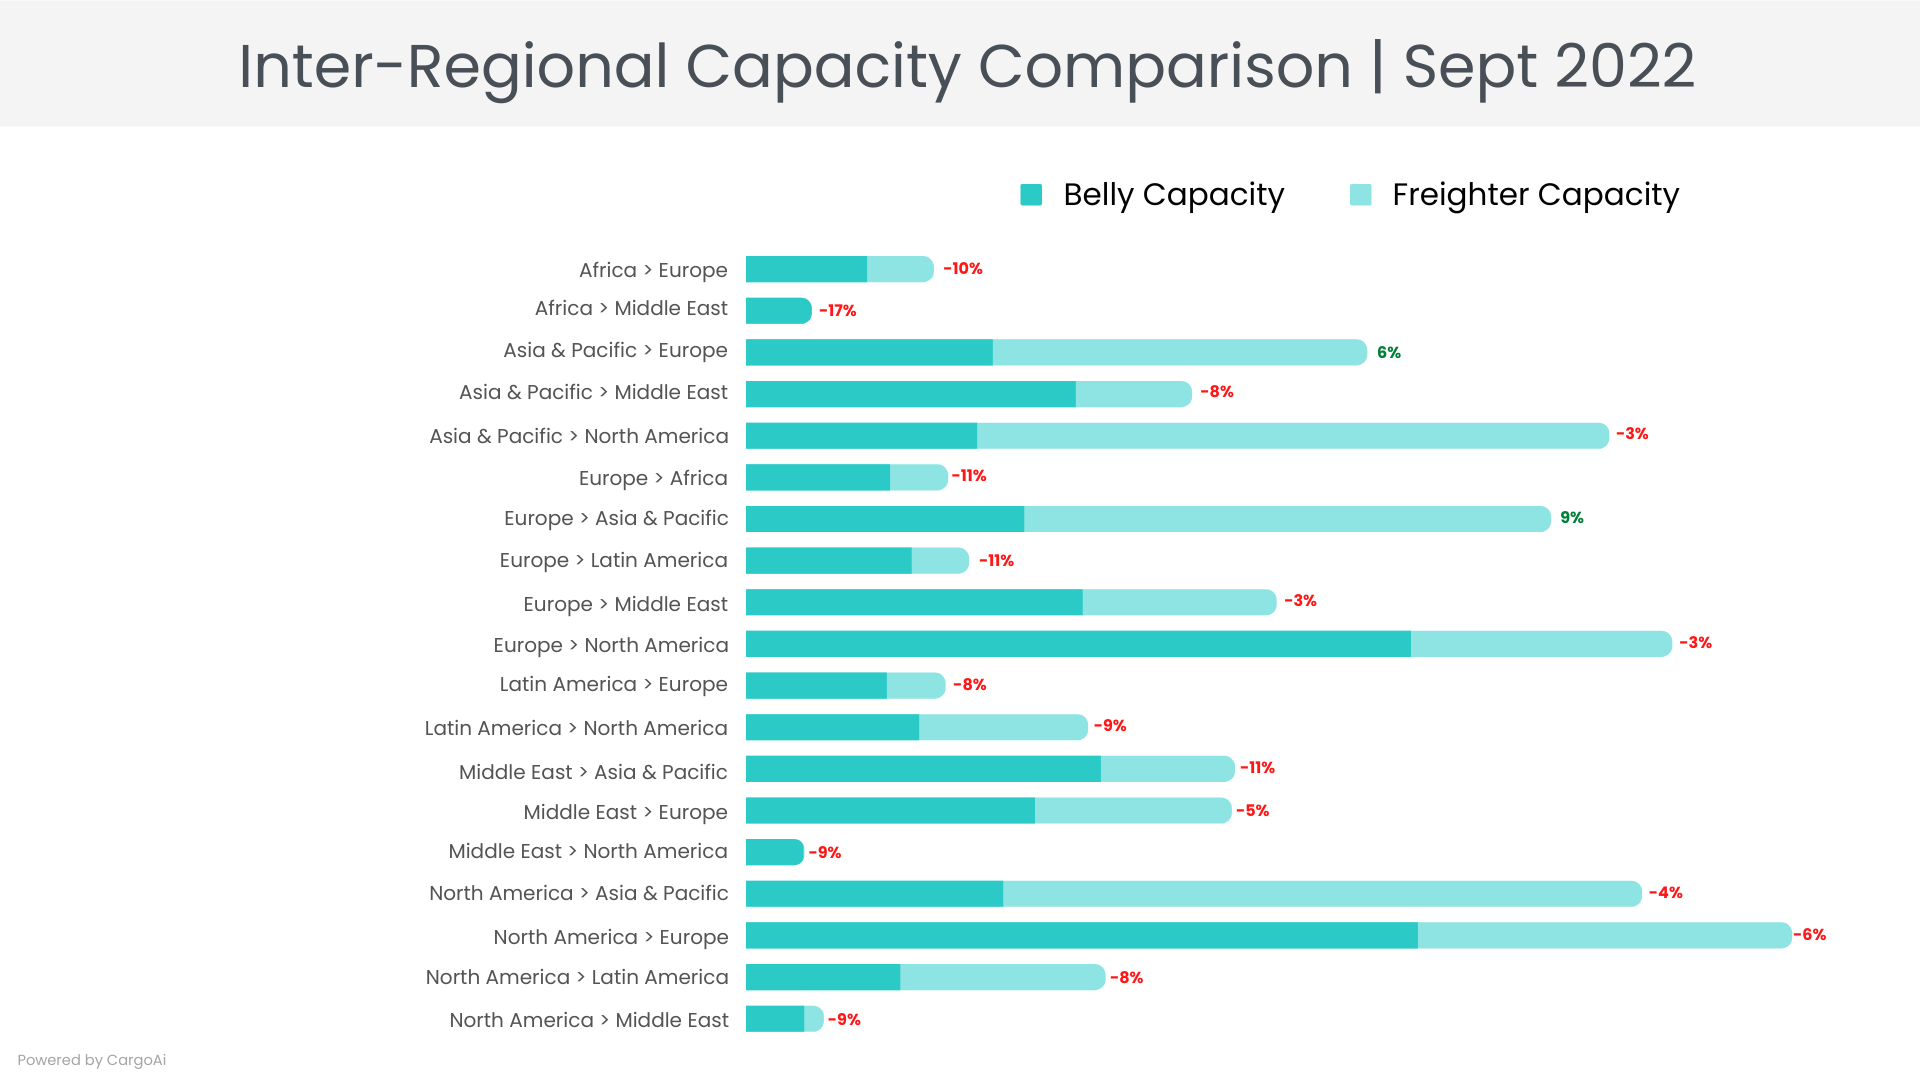
Top Inter-Regional Cargo Capacity
| Region | Capacity in Sept 2022 (100k tons) | Variance vis-a-vis Sept 2022 |
|---|---|---|
Africa Europe Europe | 58.8 | -10% |
| AfricaMiddle East | 20.4 | -17% |
| Asia & PacificEurope | 195.1 | 6% |
| Asia & PacificMiddle East | 140.1 | -8% |
| Asia & PacificNorth America | 271.2 | -3% |
| EuropeAfrica | 63.3 | -11% |
| EuropeAsia & Pacific | 252.9 | 9% |
| EuropeLatin America | 69.9 | -11% |
| EuropeMiddle East | 166.6 | -3% |
| EuropeNorth America | 291 | -3% |
| Latin AmericaEurope | 62.5 | -8% |
| Latin AmericaNorth America | 107.3 | -9% |
| Middle EastAsia & Pacific | 153.6 | -11% |
| Middle EastEurope | 152.5 | -5% |
| North AmericaAsia & Pacific | 281.4 | -4% |
| North AmericaEurope | 328.7 | -6% |
| North AmericaLatin America | 112.8 | -8% |
| North AmericaMiddle East | 24.2 | -9% |
Observations
- The freighter capacity from Asia-Pacific to Europe has increased by 13% MoM and Europe to Asia-Pacific by 16%. Further rise in overall capacity is expected from October-November from Asia-Pacific to Europe, Middle East and North America, with carriers like Lufthansa, Emirates, Air New Zealand, Qantas among others planning to increase belly and freighter capacities in their winter schedule.
- Meanwhile, the marginal reduction in overall capacity in the key corridor of Asia-Pacific to North America by 3% and the route backwards by 4% is most likely owing to the on-going dispute over traffic rights between China and US, leading to cancellation of some flights.
- The MoM decline in freighter and belly capacities from Asia-Pacific is also owing to the preface to China’s Global Week National Day holidays from October 1-7, coupled with the consequences of severe heatwave and drought in China, affecting production in markets and disarray in airport operations.
- A MoM reduction in capacity from North America to Europe by 6% is majorly due to the congestion in the European airspace and airports; the shortage of staff and strikes causing major flight cancellations.
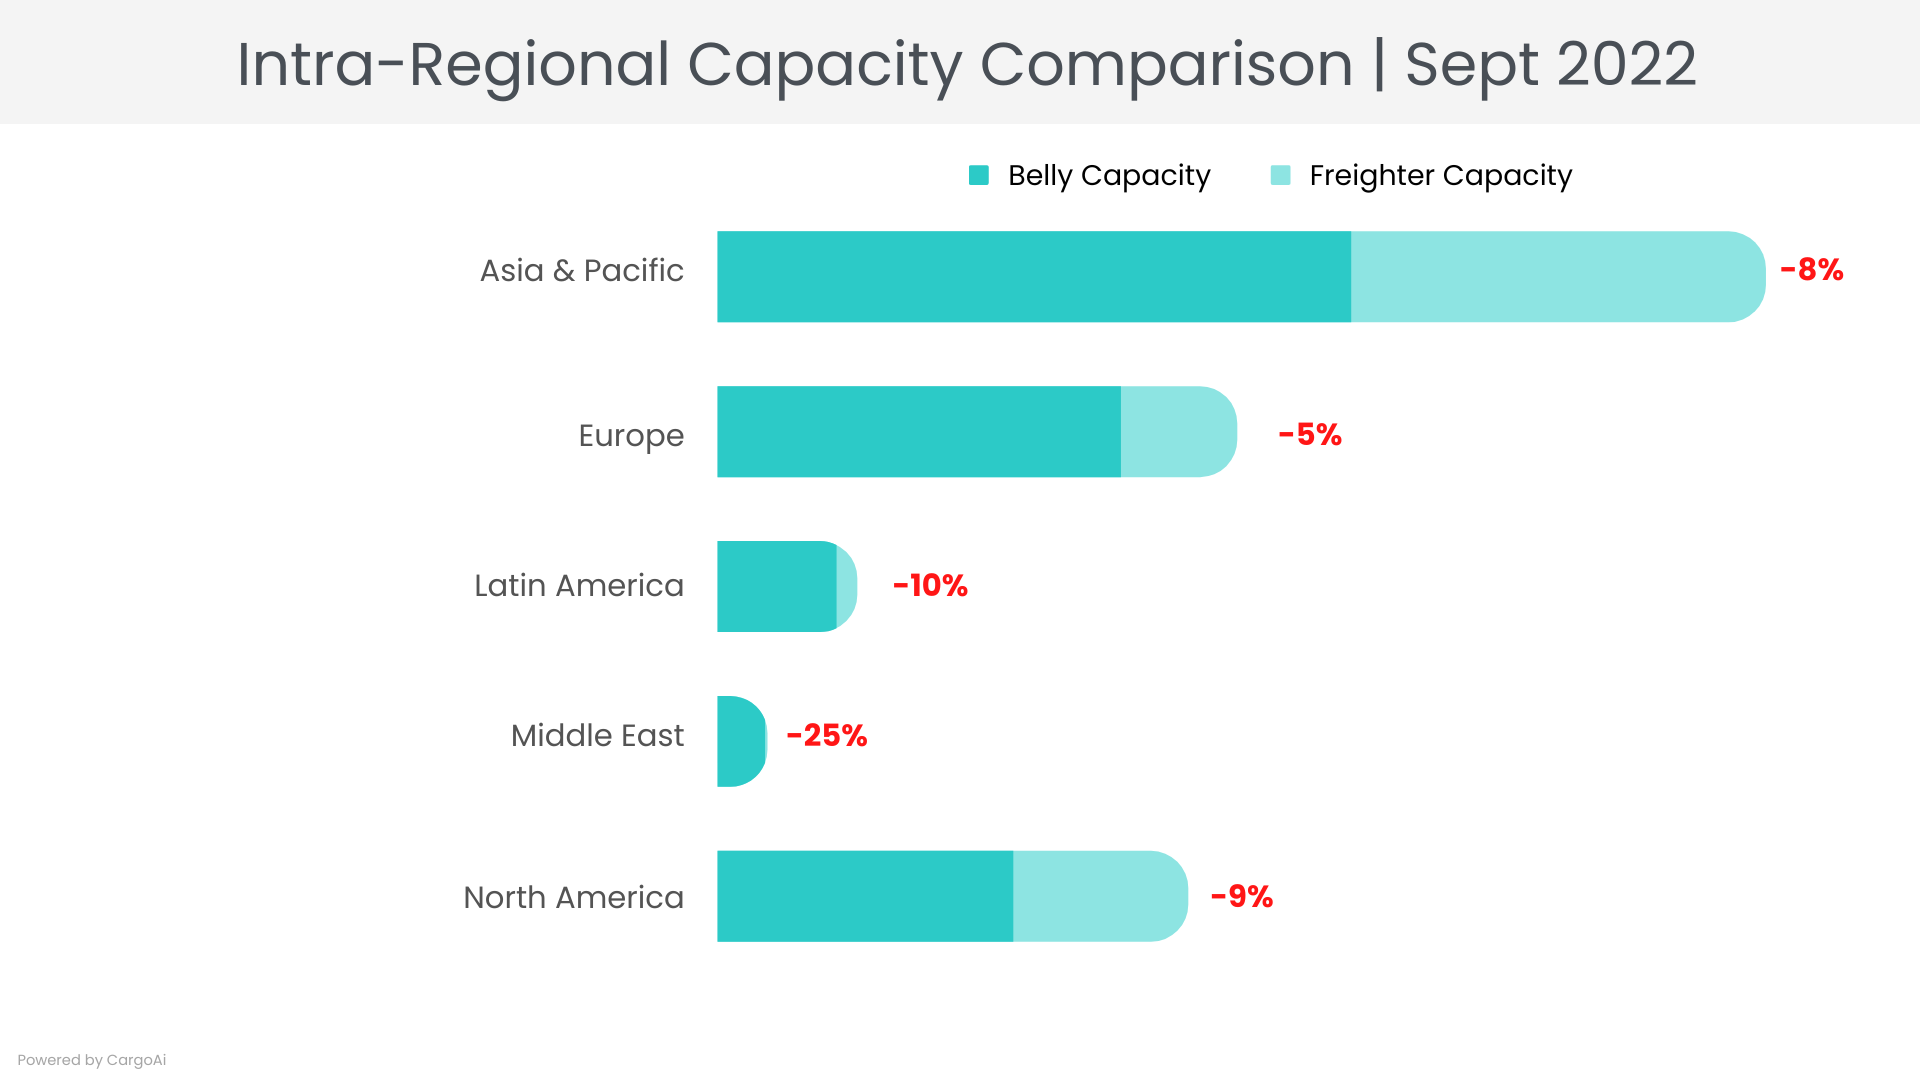
Top Intra-Regional Cargo Capacity
| Region | Capacity in Sept 2022 (100k tons) | Variance vis-a-vis Sept 2022 |
|---|---|---|
| Asia & Pacific | 2248 | -8% |
| Europe | 1131.1 | -5% |
| Latin America | 298.1 | -10% |
| Middle East | 105.3 | -25% |
| North America | 1008 | -9% |
Observations
- In September, downward trend in overall capacity has been observed within all regions as compared to August. The most notable deviations are observed within the Latin America and North America regions by -10% and -9% respectively. The major reason is the global lack of demand and reduction in chargeable weight, subsequently affecting the capacities.
- The bulkiest intra-regional capacity within the Asia-Pacific has seen a MoM downshift of 8% in September, despite increase in capacities seen from Australia and New Zealand is predominantly owing to the lead to China’s Global Week National Day holidays and the disruptions in flights and airport operations caused by the heatwaves and drought.
Air Cargo Global chargeable weight analysis
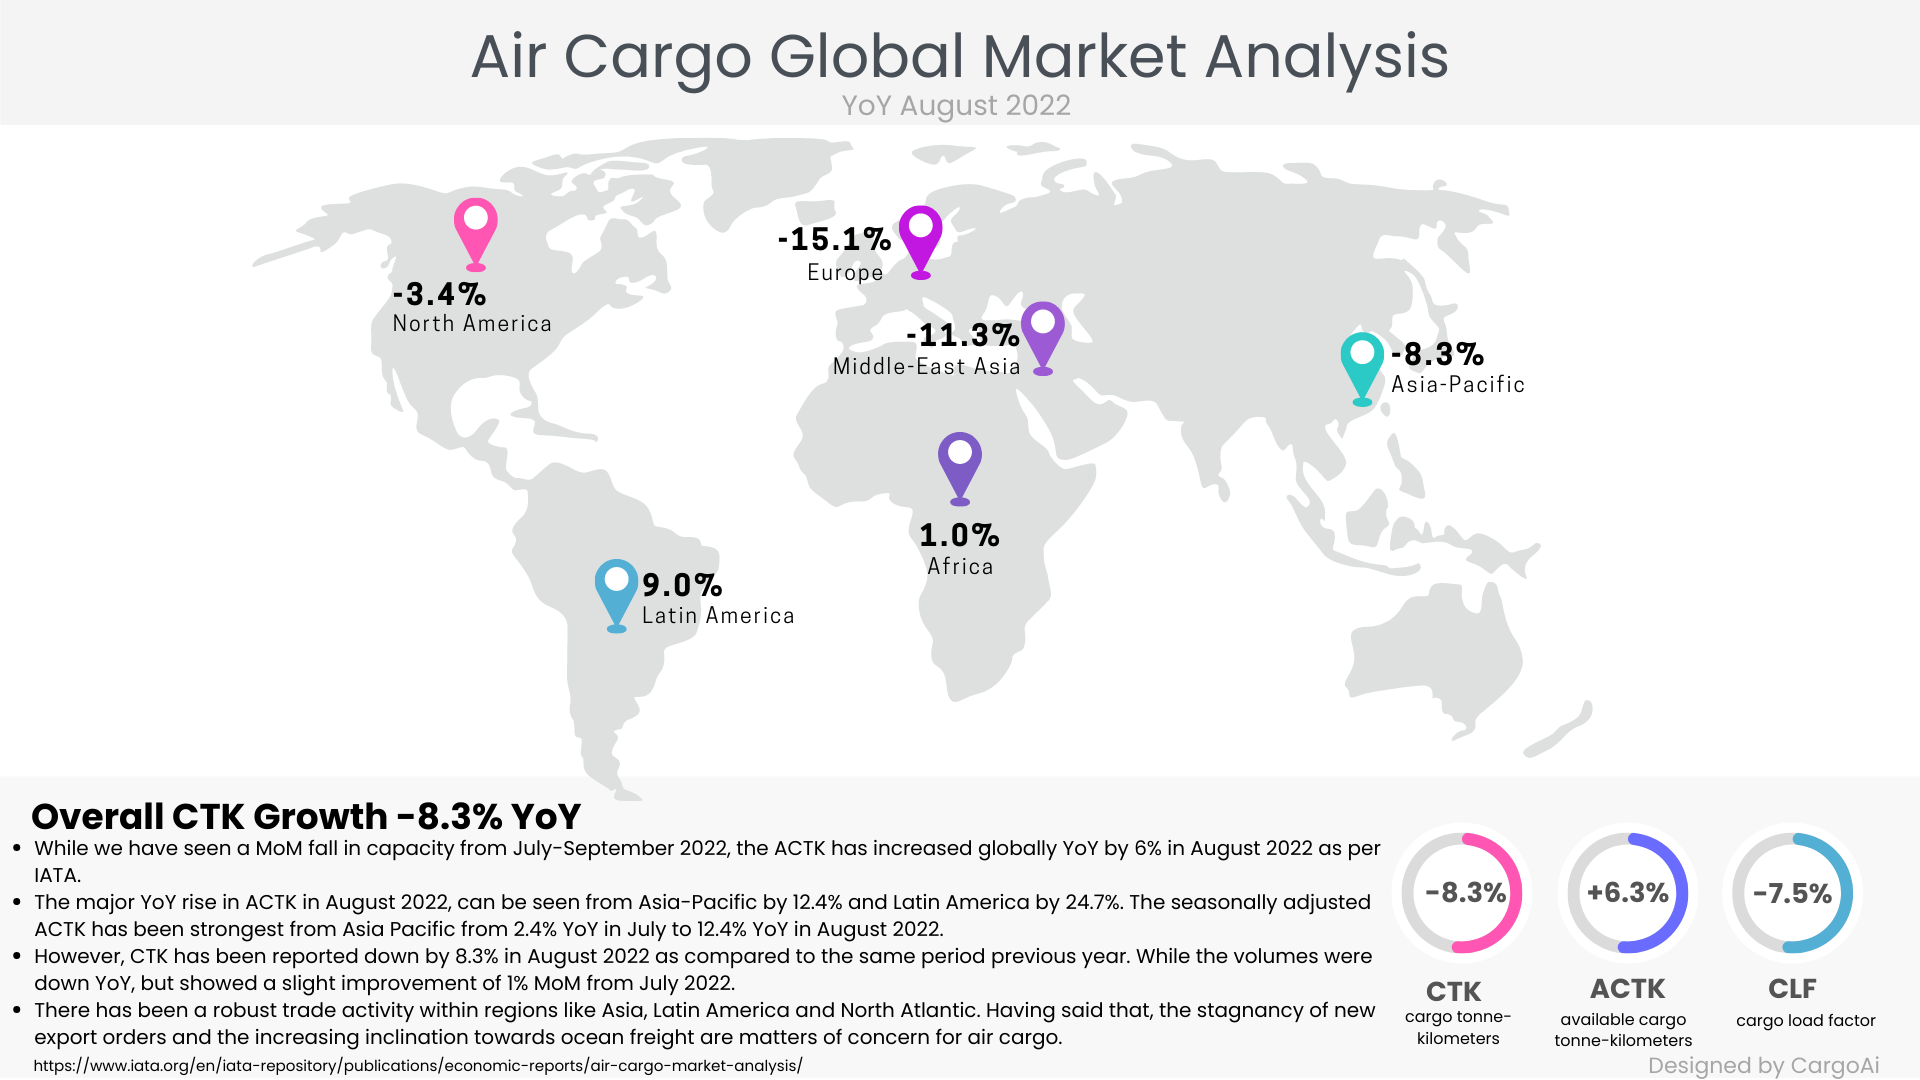
Observations
- While we have seen a MoM fall in capacity from July-September 2022, the ACTK has increased globally YoY by 6% in August 2022 as per IATA.
- The major YoY rise in ACTK in August 2022, can be seen from Asia-Pacific by 12.4% and Latin America by 24.7%. The seasonally adjusted ACTK has been strongest from Asia Pacific from 2.4% YoY in July to 12.4% YoY in August 2022.
- However, CTK has been reported down by 8.3% in August 2022 as compared to the same period previous year. While the volumes were down YoY, but showed a slight improvement of 1% MoM from July 2022.
- There has been a robust trade activity within regions like Asia, Latin America and North Atlantic. Having said that, the stagnancy of new export orders and the increasing inclination towards ocean freight are matters of concern for air cargo.
Conclusively, the unabating decline of global air cargo volumes and the levelling up of capacities and air freight rates to pre-COVID levels, calls for a surprise peak season, which is unlikely as we move on to the fourth quarter of the year.
Resources:
- https://www.maersk.com/news/articles/2022/09/27/asia-pacific-market-update-september
- https://aircargoeye.com/new-freighters-boost-lufthansa-cargos-winter-flights-schedule/
- https://www.forbes.com/sites/ceciliarodriguez/2022/09/26/traveling-to-europe-expect-more-strikes-cancellations-and-delays-this-fall-and-winter/?sh=a2b6651251a1
- https://www.iata.org/en/iata-repository/publications/economic-reports/air-cargo-market-analysis/
RECENT POSTS