
Capacity Statistics - January 2023
CargoAi features the air cargo capacity statistics report for January 2023 extracted from the business intelligence tool CargoINTEL using the real-time facts and figures. Read on for the most significant insights and analysis of inter-regional and intra-regional capacity in comparison to the previous month.
Highlights
- The last two months of year 2022 experienced acute reduction in capacity due to various factors like the festive vacation causing reduction in demand and consequent narrowing of freighter routes; severe winter weather conditions and strikes causing flights cancellations from Europe; and the winter-storm causing flight delays and cancellations in USA.
- The global capacity in the New Year showed positive signs and stabilized to the levels of October 2022.
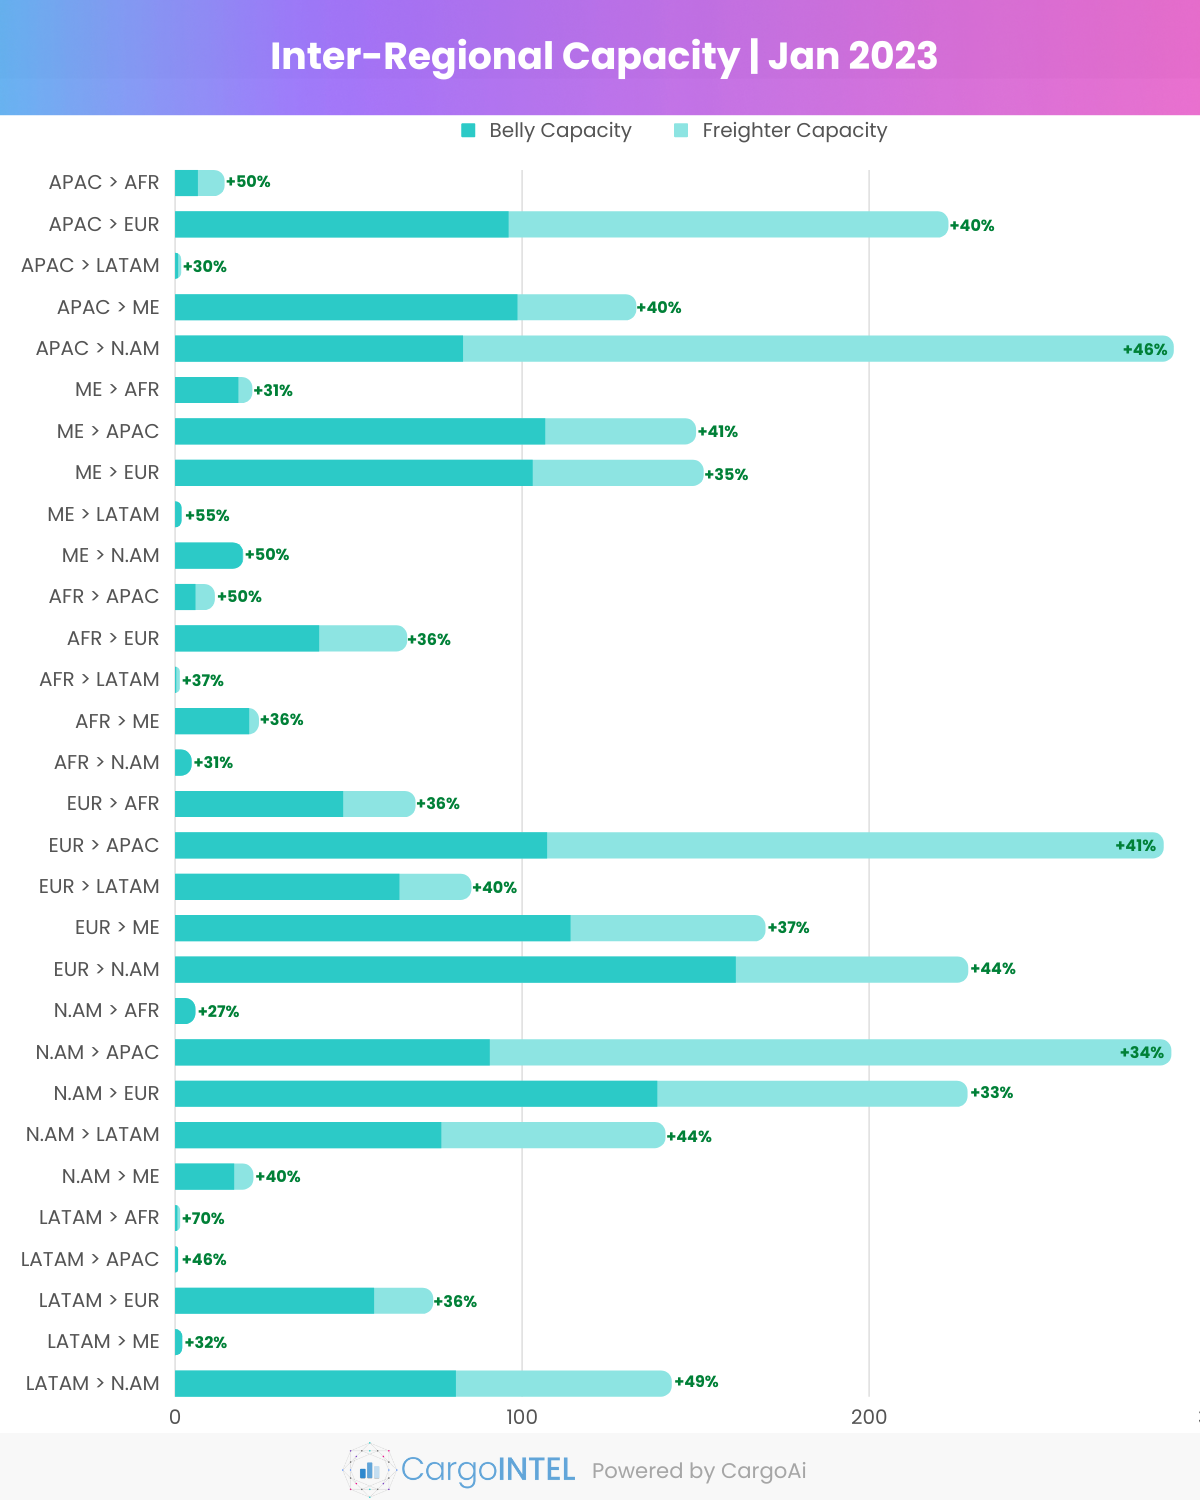
- The inter-regional capacity in January has improved by 40% month-on-month from 2042K MT in December 2022 to 2854K MT in January 2023.
- The disruption of the scheduled operation of flights in December 2022 caused the global belly capacity to reduce to an-year low of 21% MoM, but with the normalizing of passenger flight operations globally, the indexed belly capacity increased by 44% from 1093K MT in December to 1571K MT January.
- The global freighter capacity also saw an increase of 35% in January to 1282K MT in January 2023 as compared to the previous month which was 949K MT.
- Despite, the Lunar New Year holidays in Asia and the ensuing lack of demand towards week 4 of the year, the freighter capacity was observed to be at the levels of what it was by the end of third quarter of year 2022.
- WACD figures suggest a slight increase in tonnages by 1% in week 3 and 4 as compared to first two weeks of 2023. Whereas, the tonnages increased by almost 19% in the first two weeks of January 2023 as compared to the last two weeks of December 2022.
- However, the air freight rates have further reported to have lowered by 4% MoM, and a YoY drop by 28%.
Top Inter-Regional Cargo Capacity
Asia Pacific Region
| Region | Capacity in Jan 2023 (100k tons) | Variance vis-a-vis Jan 2023 |
|---|---|---|
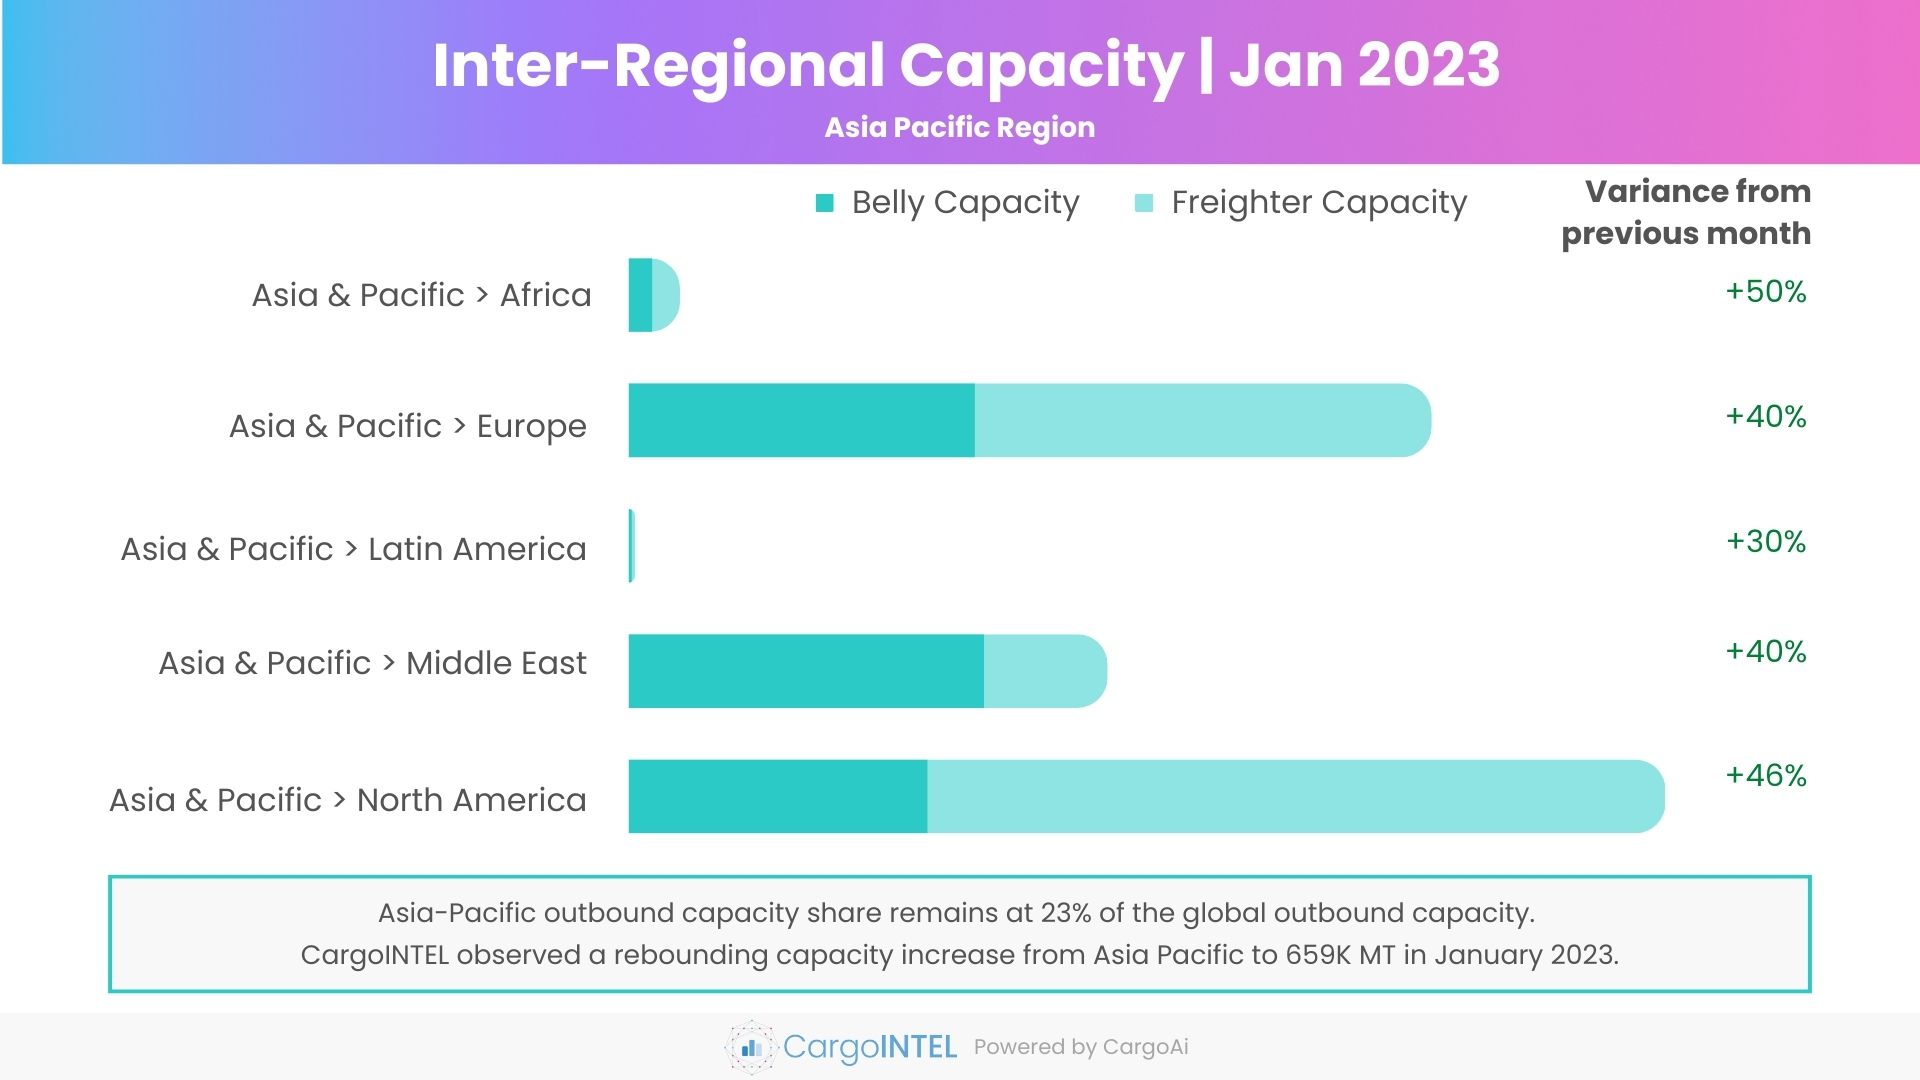
Asia & Pacific Africa Africa | 14.1 | 50% |
| Asia & PacificEurope | 222.6 | 40% |
| Asia & PacificLatin America | 1.6 | 30% |
| Asia & PacificMiddle East | 132.7 | 40% |
| Asia & PacificNorth America | 287.5 | 46% |
Observations
- The sharp fall in the outbound capacity from the Asia-Pacific region in the last two months of 2022 caused the major impact on global capacity.
- Despite the Chinese and Lunar New Year closures in China, Hong Kong and other parts of Asia, we observed a rebounding capacity from Asia Pacific, that surged MoM by 43% from 461K MT in December to 659K MT in January.
- The belly capacity from Asia Pacific grew by 51% in January to 285K MT from an all-year low of 189K MT in December 2022, which is indicative of the reinstating passenger flights frequencies.
- Despite the tonnages going down in January due to the early CNY, the indexed freighter capacity strongly scaled up from Asia Pacific to Europe to 127K MT (+34% MoM) and from Asia-Pacific to North America to 205K MT (+43% MoM).
- A year-on-year comparison for the same period shows that tonnages from Asia Pacific are down by 30%, whereas the capacity has gone up by 12%.
Middle East Region
| Region | Capacity in Jan 2023 (100k tons) | Variance vis-a-vis Jan 2023 |
|---|---|---|
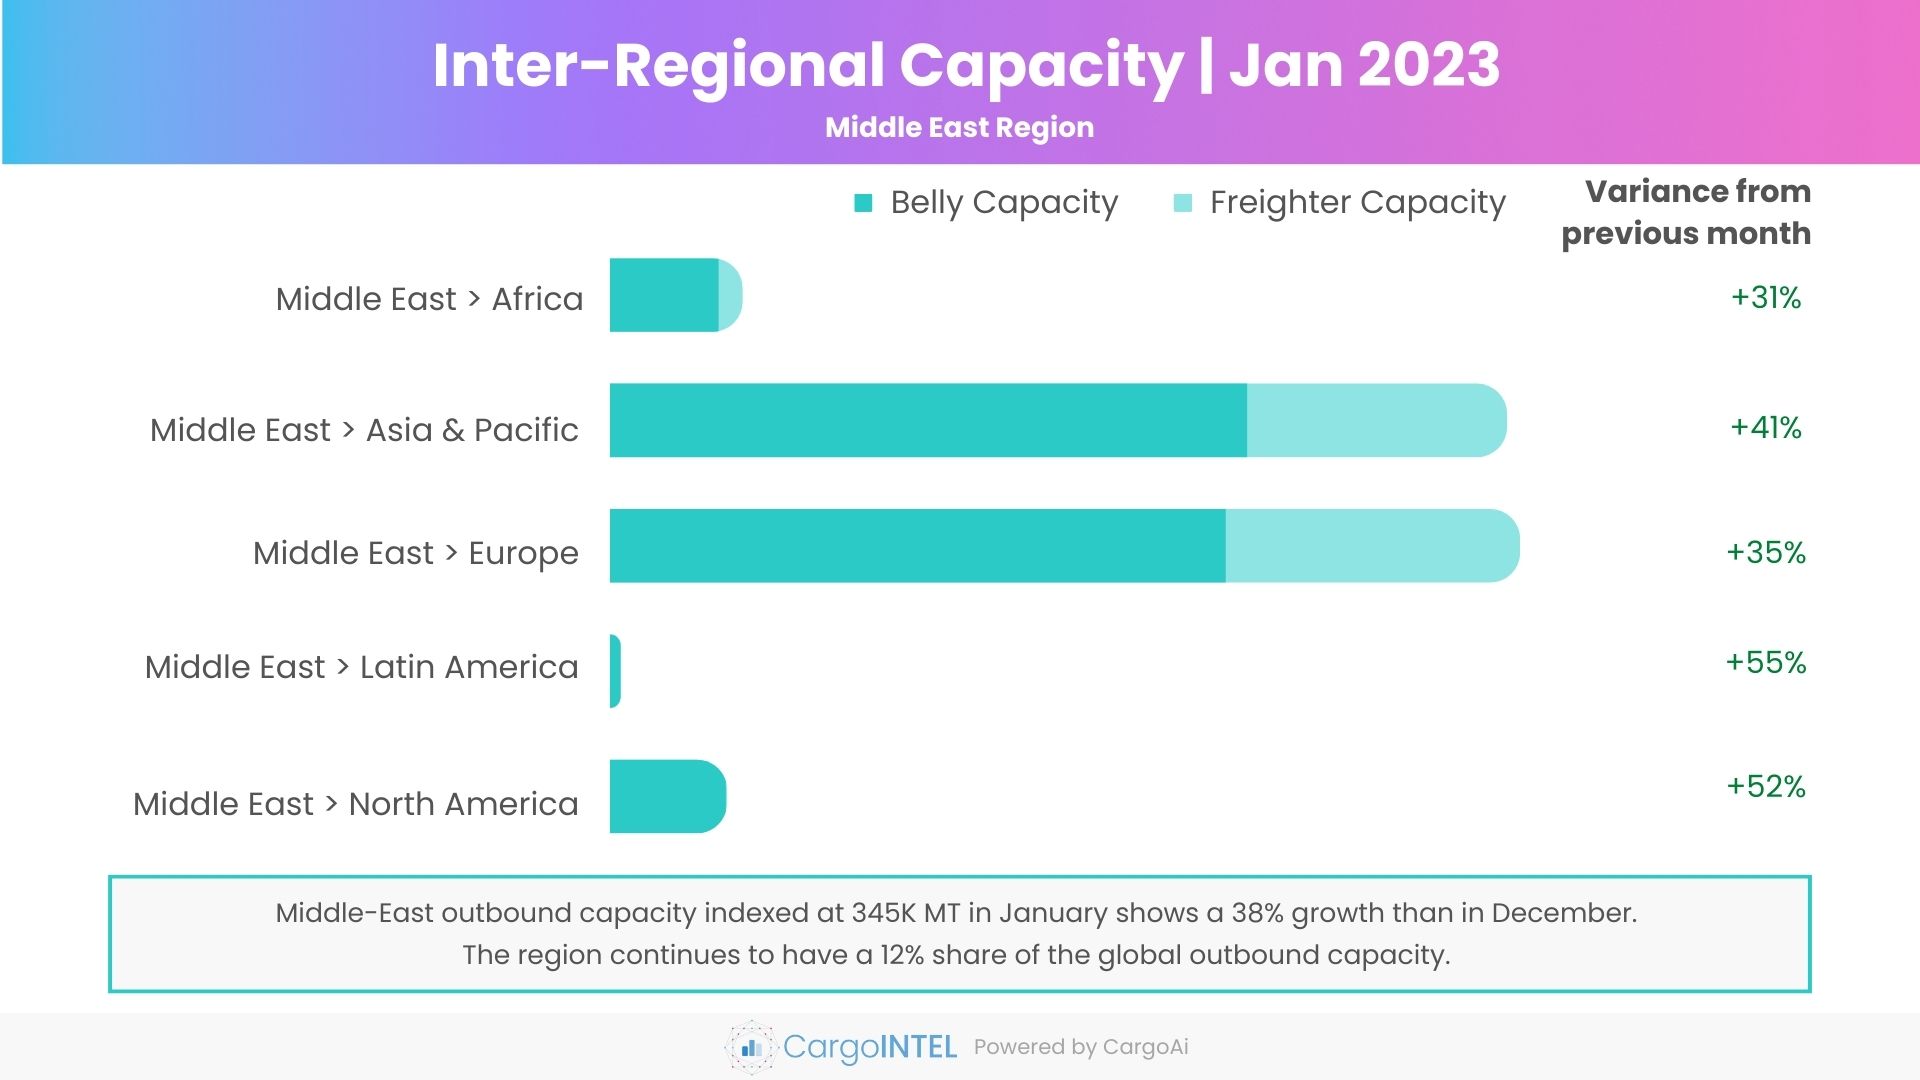
| Middle EastAfrica | 22.1 | 31% |
| Middle EastAsia & Pacific | 149.9 | 41% |
| Middle EastEurope | 152.1 | 35% |
| Middle EastLatin America | 1.7 | 55% |
| Middle EastNorth America | 19.5 | 52% |
Observations
- The overall outbound capacity from the Middle-East in January at 345K MT increased by 38% vis-à-vis December.
- The capacity curtailed by Middle-Eastern carriers in December owing to various reasons like year-end slowdown, extreme weather conditions in Europe and US, etc bounced back with in January regularising frequencies.
- The increase in belly capacity from Middle-East to Asia Pacific by 46% from 73K MT in December to 107K MT in January, and Middle-East to Europe by 47% from 70K MT in December to 103K MT in January, are clear signs of reinstating of passenger flight schedules by the carriers.
Africa Region
| Region | Capacity in Jan 2023 (100k tons) | Variance vis-a-vis Jan 2023 |
|---|---|---|
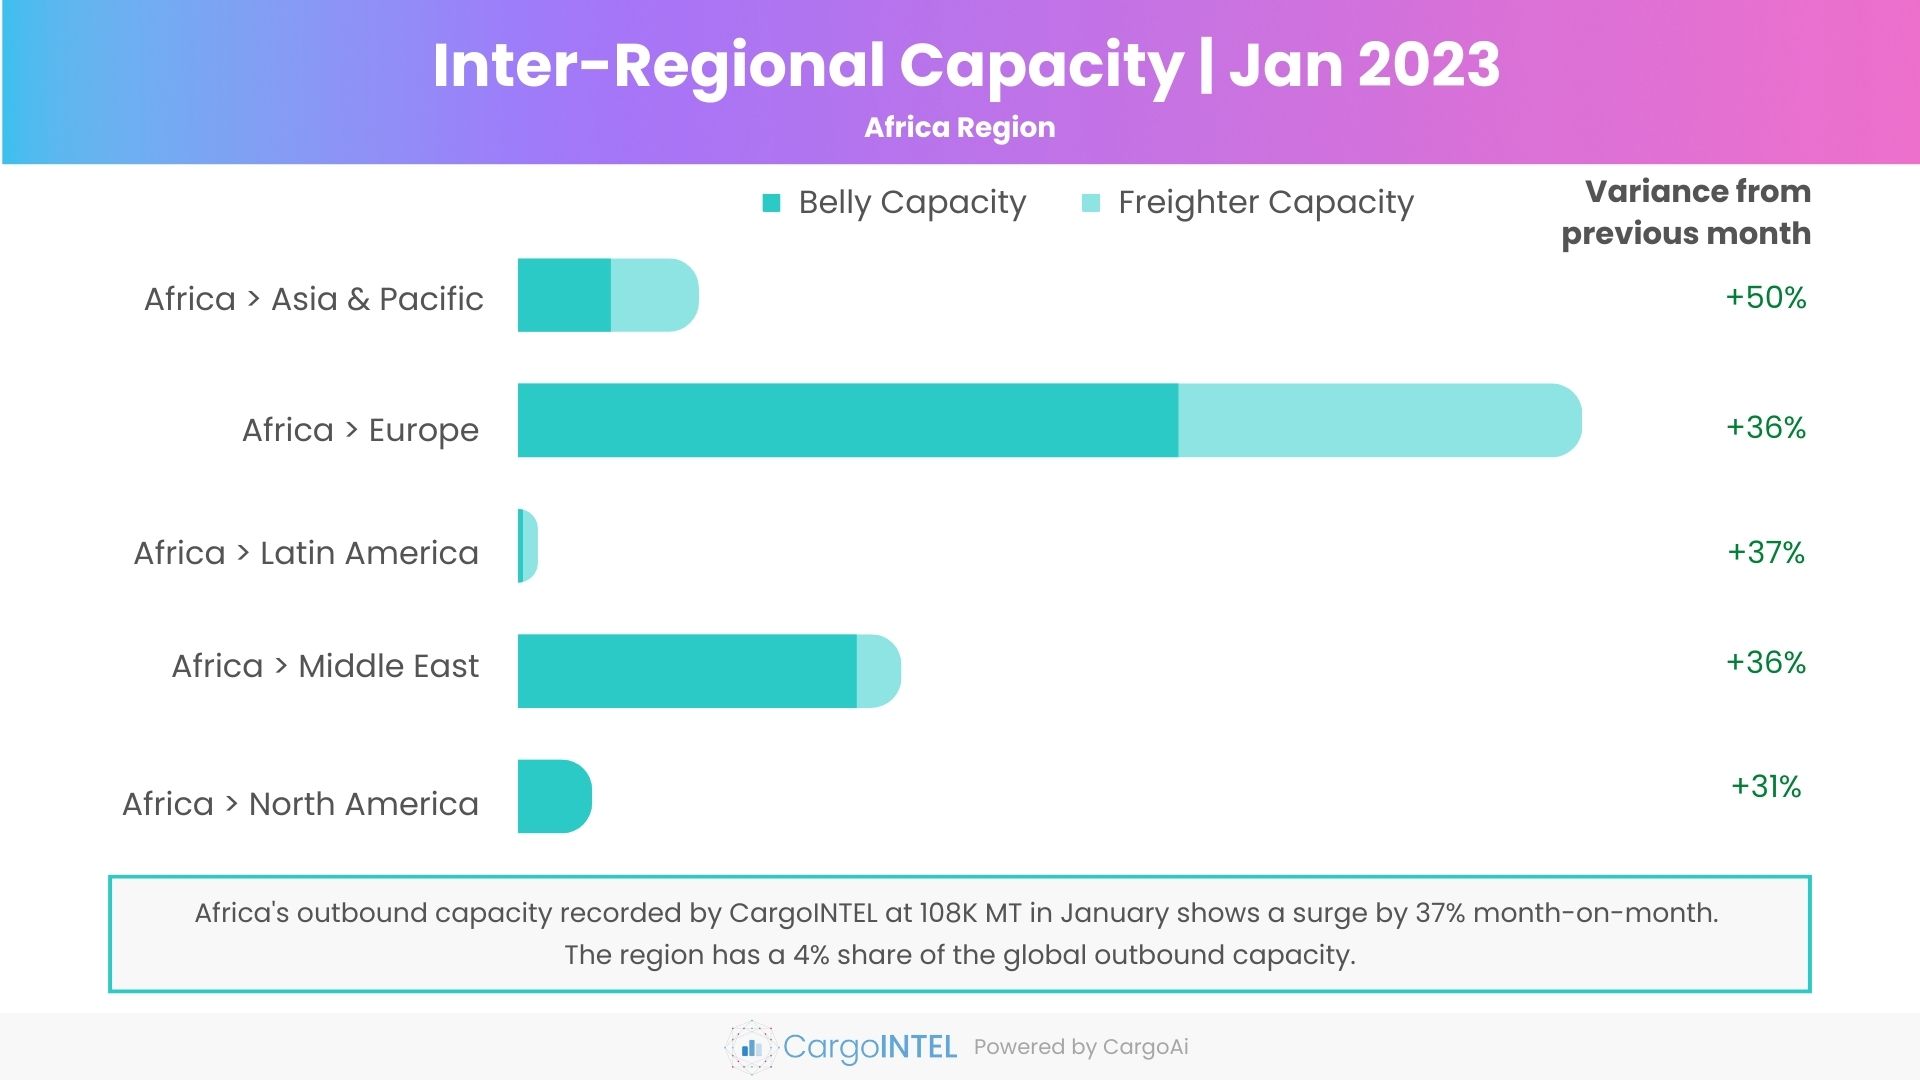
| AfricaAsia & Pacific | 11.3 | 50% |
| AfricaEurope | 66.7 | 36% |
| AfricaLatin America | 1.2 | 37% |
| AfricaMiddle East | 24 | 36% |
| AfricaNorth America | 4.6 | 31% |
Observations
- Overall outbound capacity from Africa has increased by 37% month-on-month from 79K MT in December to 108K MT in January.
- The freighter capacity from Africa has rose up by 44% from 24K MT in December to 35K MT in January, which is indicative of the restoring schedules and frequencies of the freighter operations by African carriers, mainly to Europe and Asia Pacific.
- We can expect the outbound capacity from Africa to further increase during the year with the new routes being planned to the US and Asia by big carriers like Ethiopian Airlines.
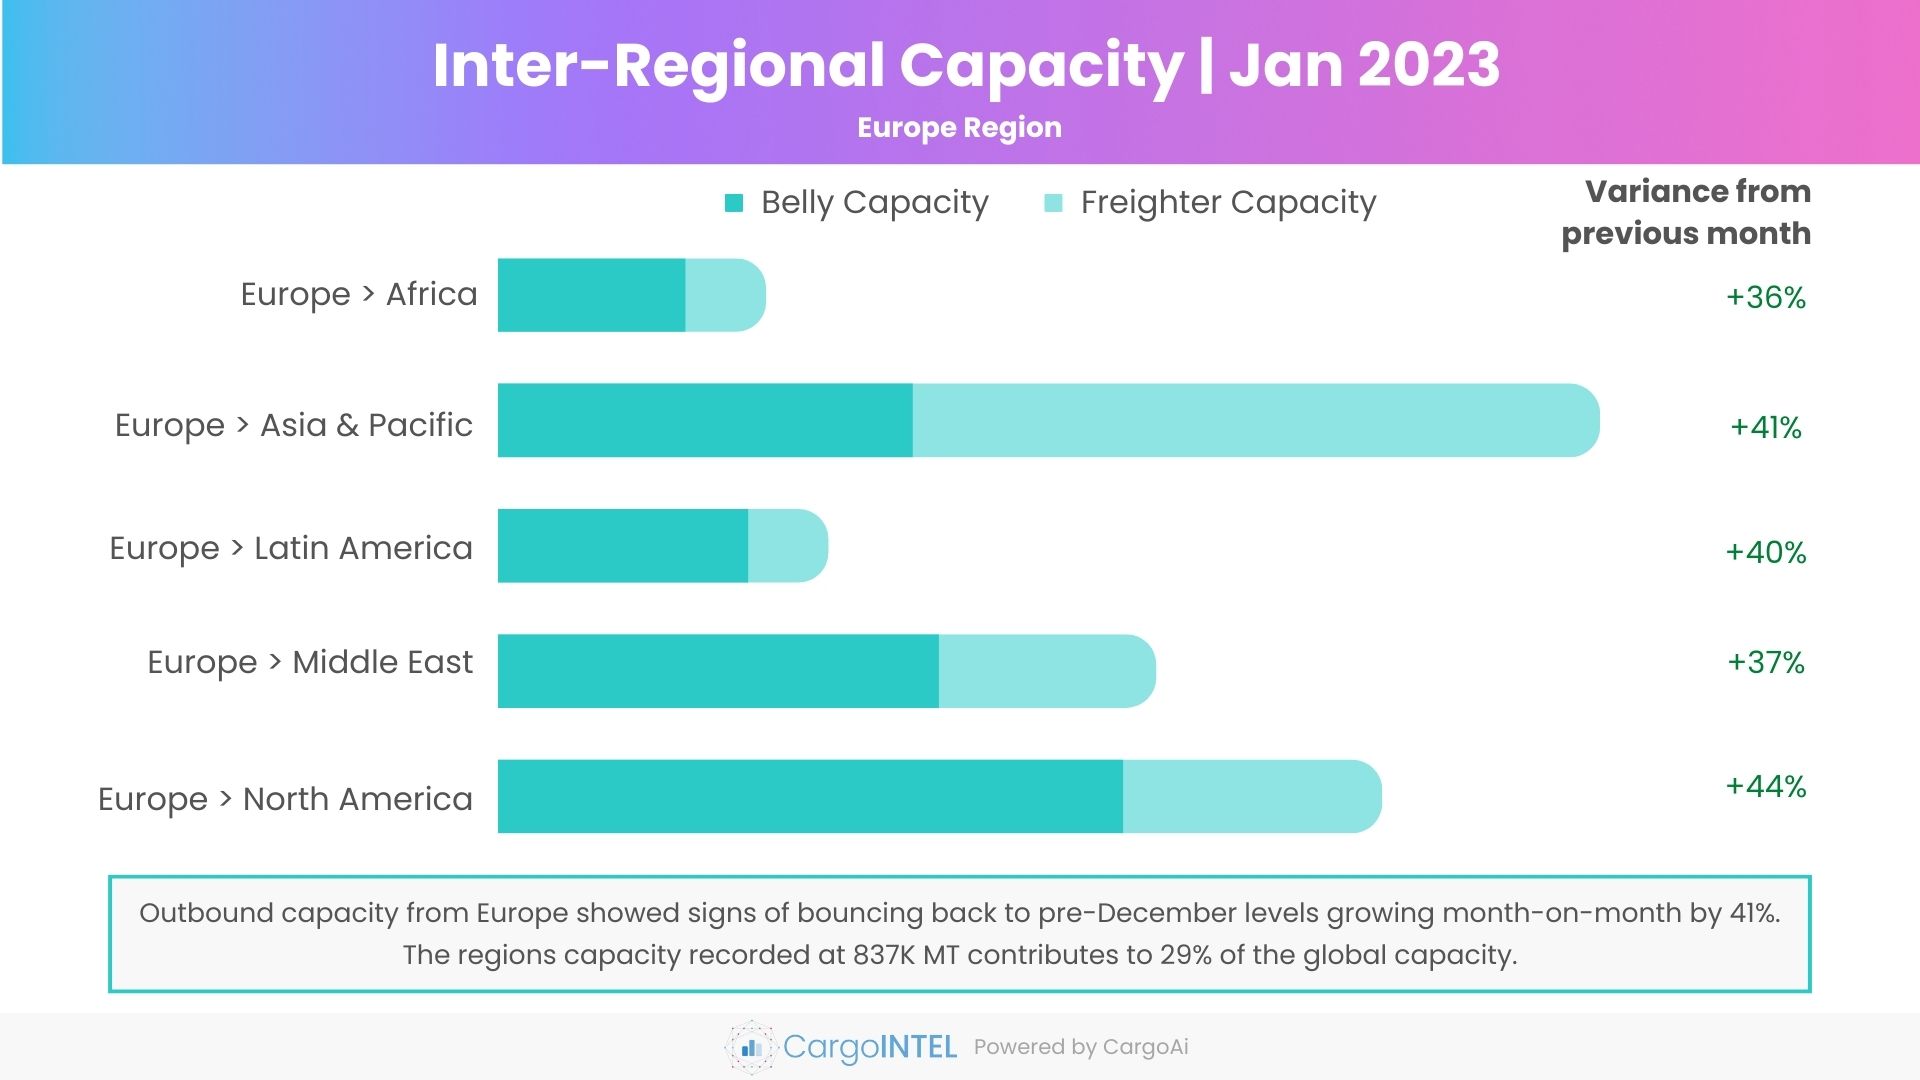
Europe Region
| Region | Capacity in Jan 2023 (100k tons) | Variance vis-a-vis Jan 2023 |
|---|---|---|
| EuropeAfrica | 69.1 | 36% |
| EuropeAsia & Pacific | 284.6 | 41% |
| EuropeLatin America | 85.2 | 40% |
| EuropeMiddle East | 169.9 | 37% |
| EuropeNorth America | 228.3 | 44% |
Observations
- In January 2023, the overall outbound capacity from Europe showed signs of bouncing back to pre-December levels growing month-on-month by 41% from 596K MT in December to 837K MT in January.
- While, there have not been major additions of frequency or new routes, the positive variance is owing to the lesser flight cancellations from Europe with the improvement in weather conditions. However, industrial strikes are still taking place at various countries across which is affecting the flight operations and thereby the belly capacity.
- The outbound belly capacity ex-Europe recorded by CargoINTEL for January 2023 stands at 495K MT, which is a 44% rise from the previous month and is at par with the indexed belly capacity in October 2022.
- WACD has recorded increase in tonnages from Europe to North America (+44%) and to Latin America (+43%) in the first two weeks of January 2023 vis-à-vis last two weeks of December.
- A corresponding month-on-month increase in outbound capacity was observed by CargoINTEL, Europe to North America increased by 44% from 158K MT in December to 228K MT in January; Europe to Latin America by +40% from 61K MT in December to 85K MT in January.
- Outbound capacity from Europe to Asia Pacific also levelled up the pre-December mark and was charted at 284 K MT.
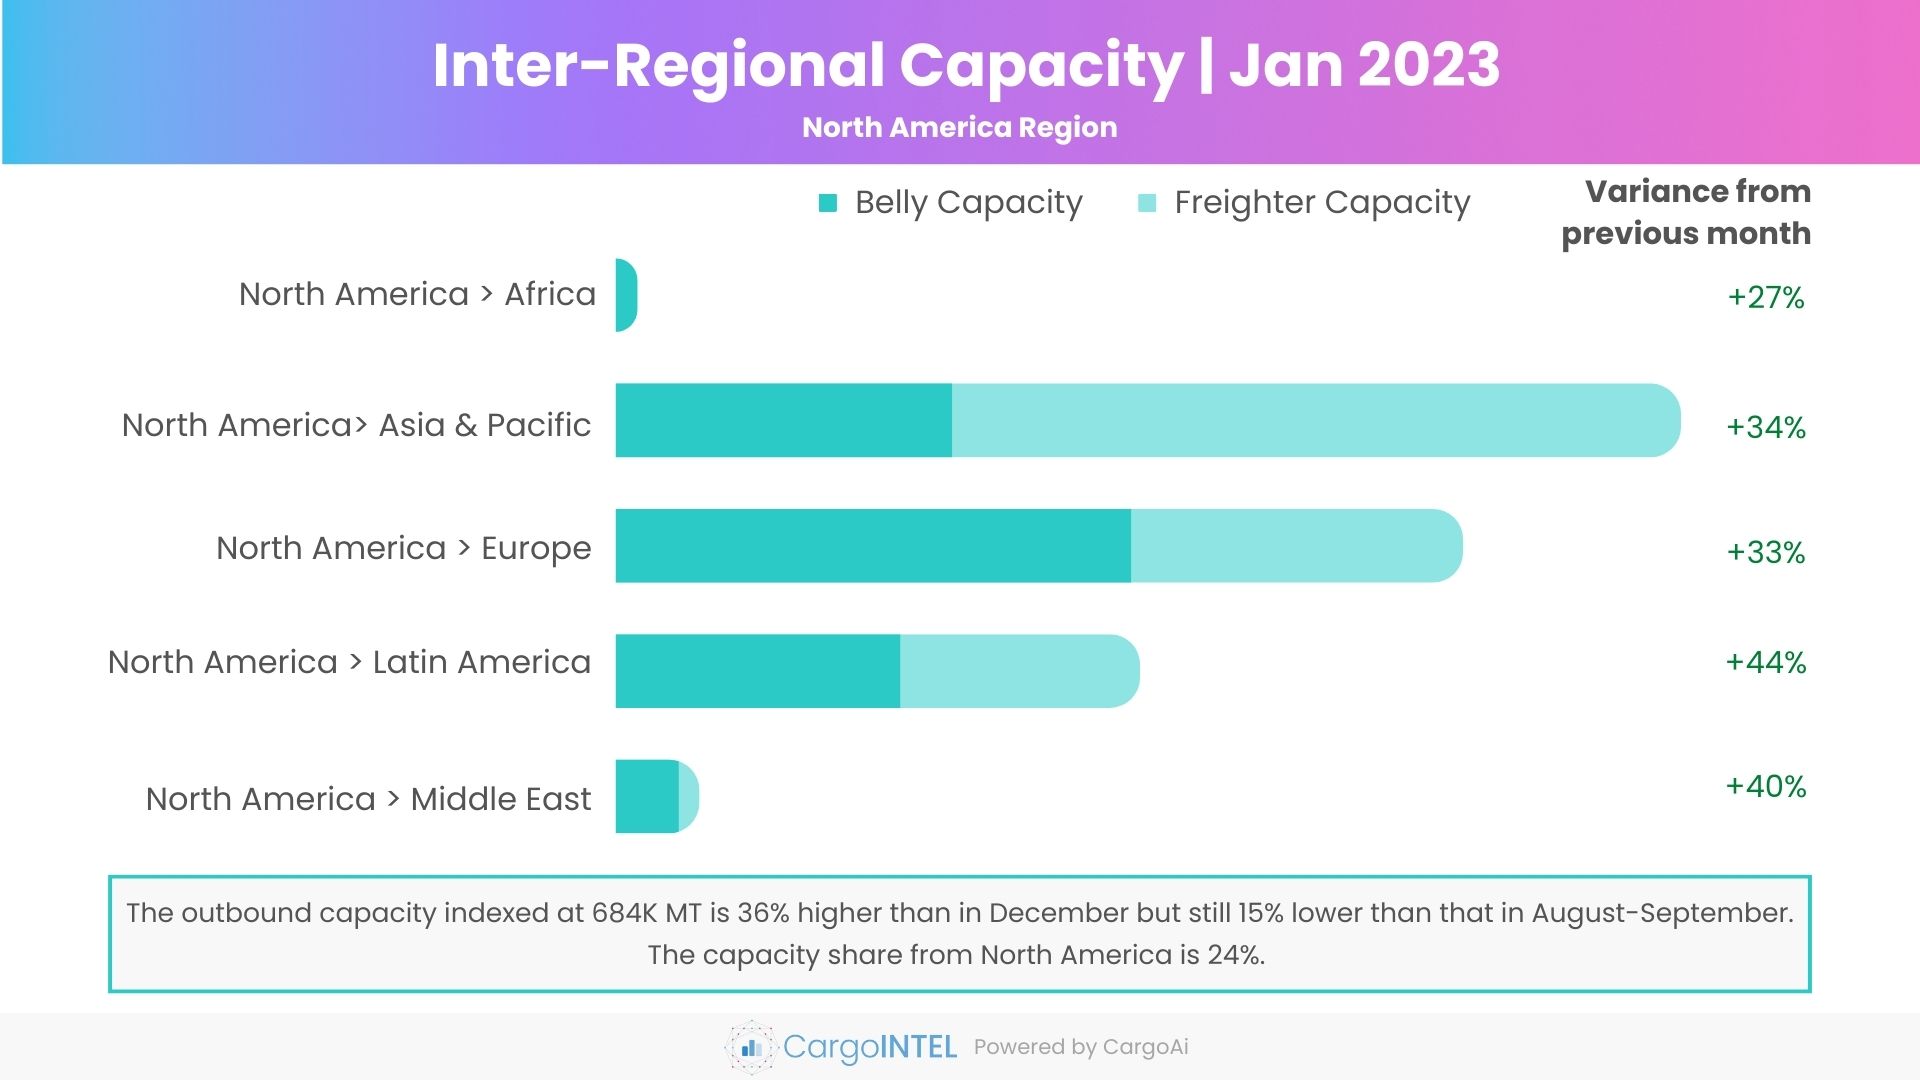
North America Region
| Region | Capacity in Jan 2023 (100k tons) | Variance vis-a-vis Jan 2023 |
|---|---|---|
| North AmericaAfrica | 5.7 | 27% |
| North AmericaAsia & Pacific | 286.8 | 34% |
| North AmericaEurope | 228.1 | 33% |
| North AmericaLatin America | 141.1 | 44% |
| North AmericaMiddle East | 22.4 | 40% |
Observations
- After the Tropical Storm Nicole and winter Storm Elliot caused major flights cancellations in December, the steadily normalizing flight situation has led to a 36% month-on-month improvement in overall outbound capacity from North America to 684K MT in January 2023.
- However, the outbound capacity indexed is yet to attain the Q3-2022 mark, and is 15% lower than that in August-September 2022, as the saga of flight cancellations continue in the US due to weather conditions.
- In January, the tonnages are recorded to have increased by 33% from North America to Europe and by 34% from North America to Latin America, based on the 2Wo2W comparison study by WACD performed by the end of the month.
- North America to Latin America capacity indexed by CargoINTEL coheres to the above observation, with an increase in terms of both belly capacity by +46% from 53K MT in December to 76K MT in January; and freighter capacity by 41% from 46K MT in December to 65K MT in January.
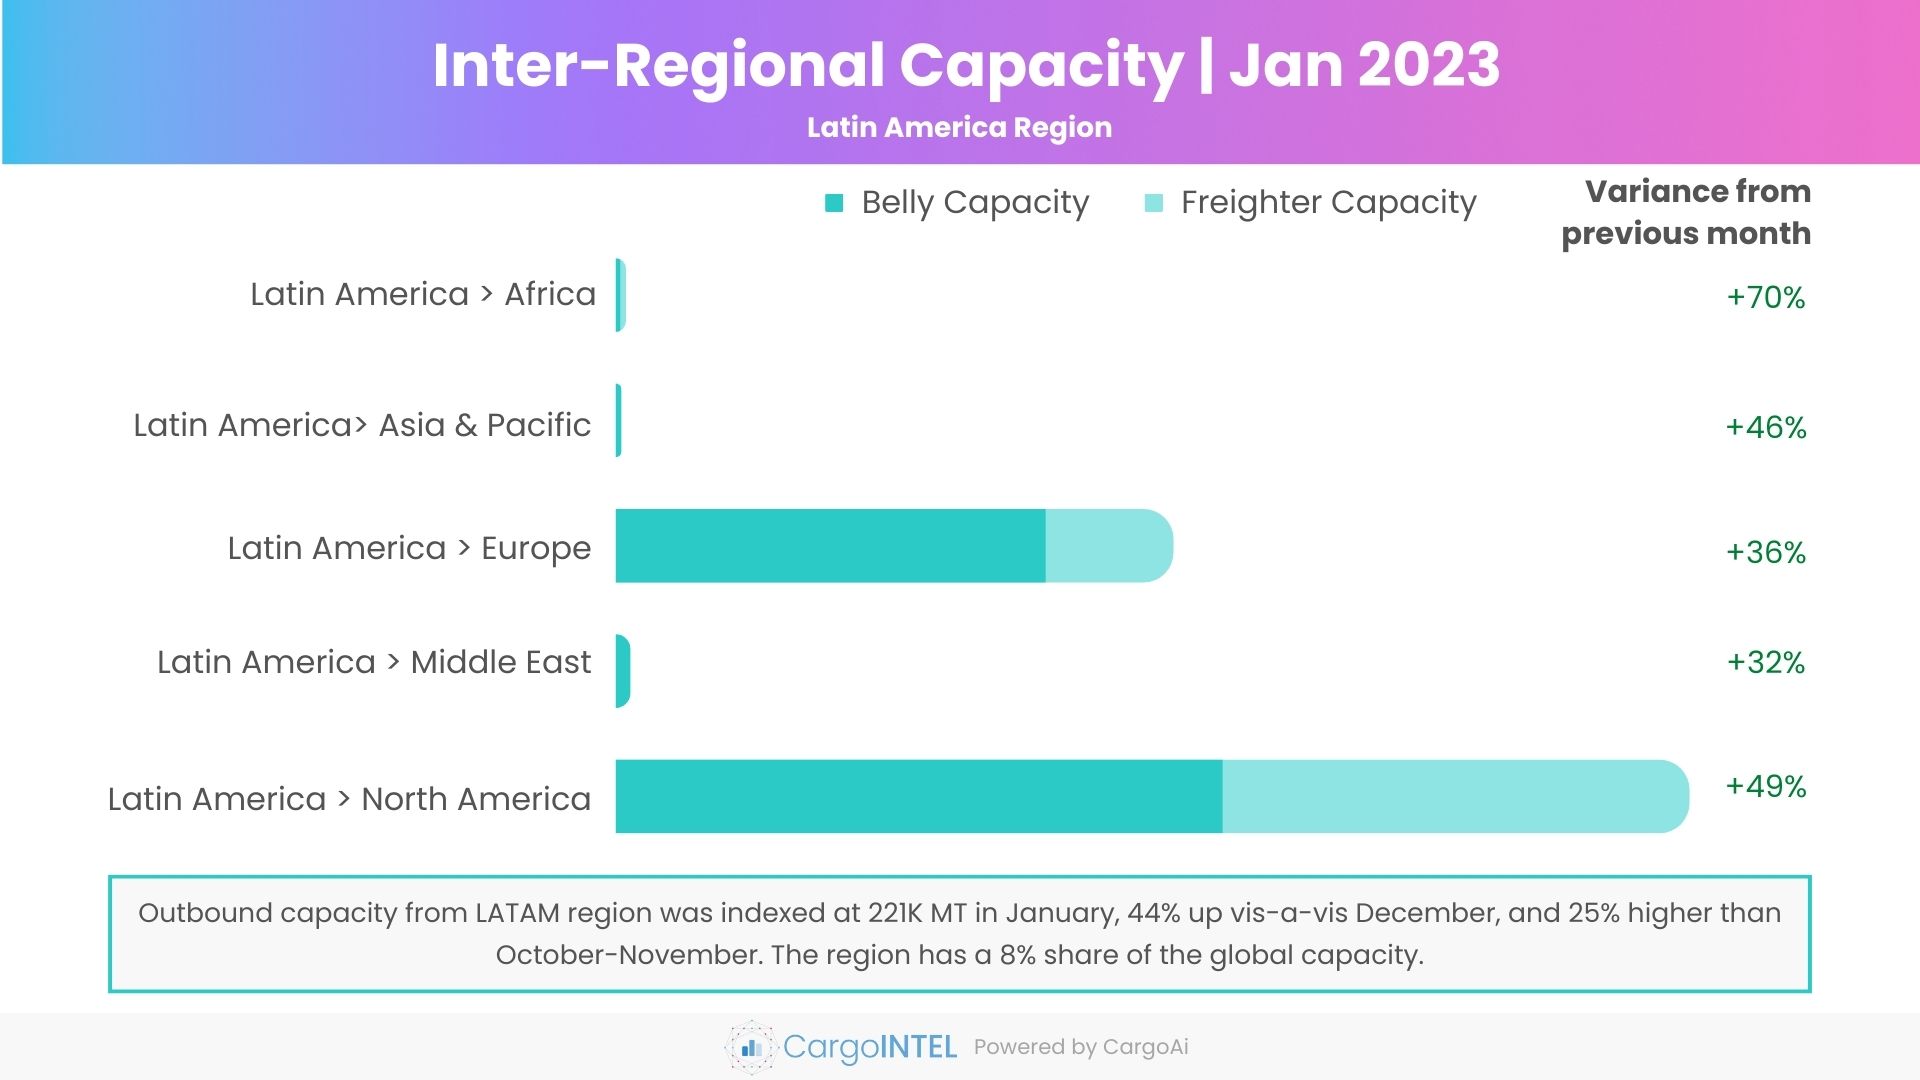
Latin America Region
| Region | Capacity in Jan 2023 (100k tons) | Variance vis-a-vis Jan 2023 |
|---|---|---|
| Latin AmericaAfrica | 1.3 | 70% |
| Latin AmericaAsia & Pacific | 0.7 | 46% |
| Latin AmericaEurope | 74.2 | 36% |
| Latin AmericaMiddle East | 1.9 | 32% |
| Latin AmericaNorth America | 142.9 | 49% |
Observations
- A disruption in capacity was observed by CargoINTEL from Latin America in December as a foil to the constant stability maintained by the region throughout 2022.
- The overall outbound capacity from the region was indexed at 221K MT in January, a 44% improvement from December, and 25% increase from that in October-November 2022.
- This can be attributed to the new routes made operational by Columbian airline Avianca and some new routes by American Airlines between Mexico and US.
- An increase in tonnages between North America and Latin America BY 34% has been recorded in January by WACD.
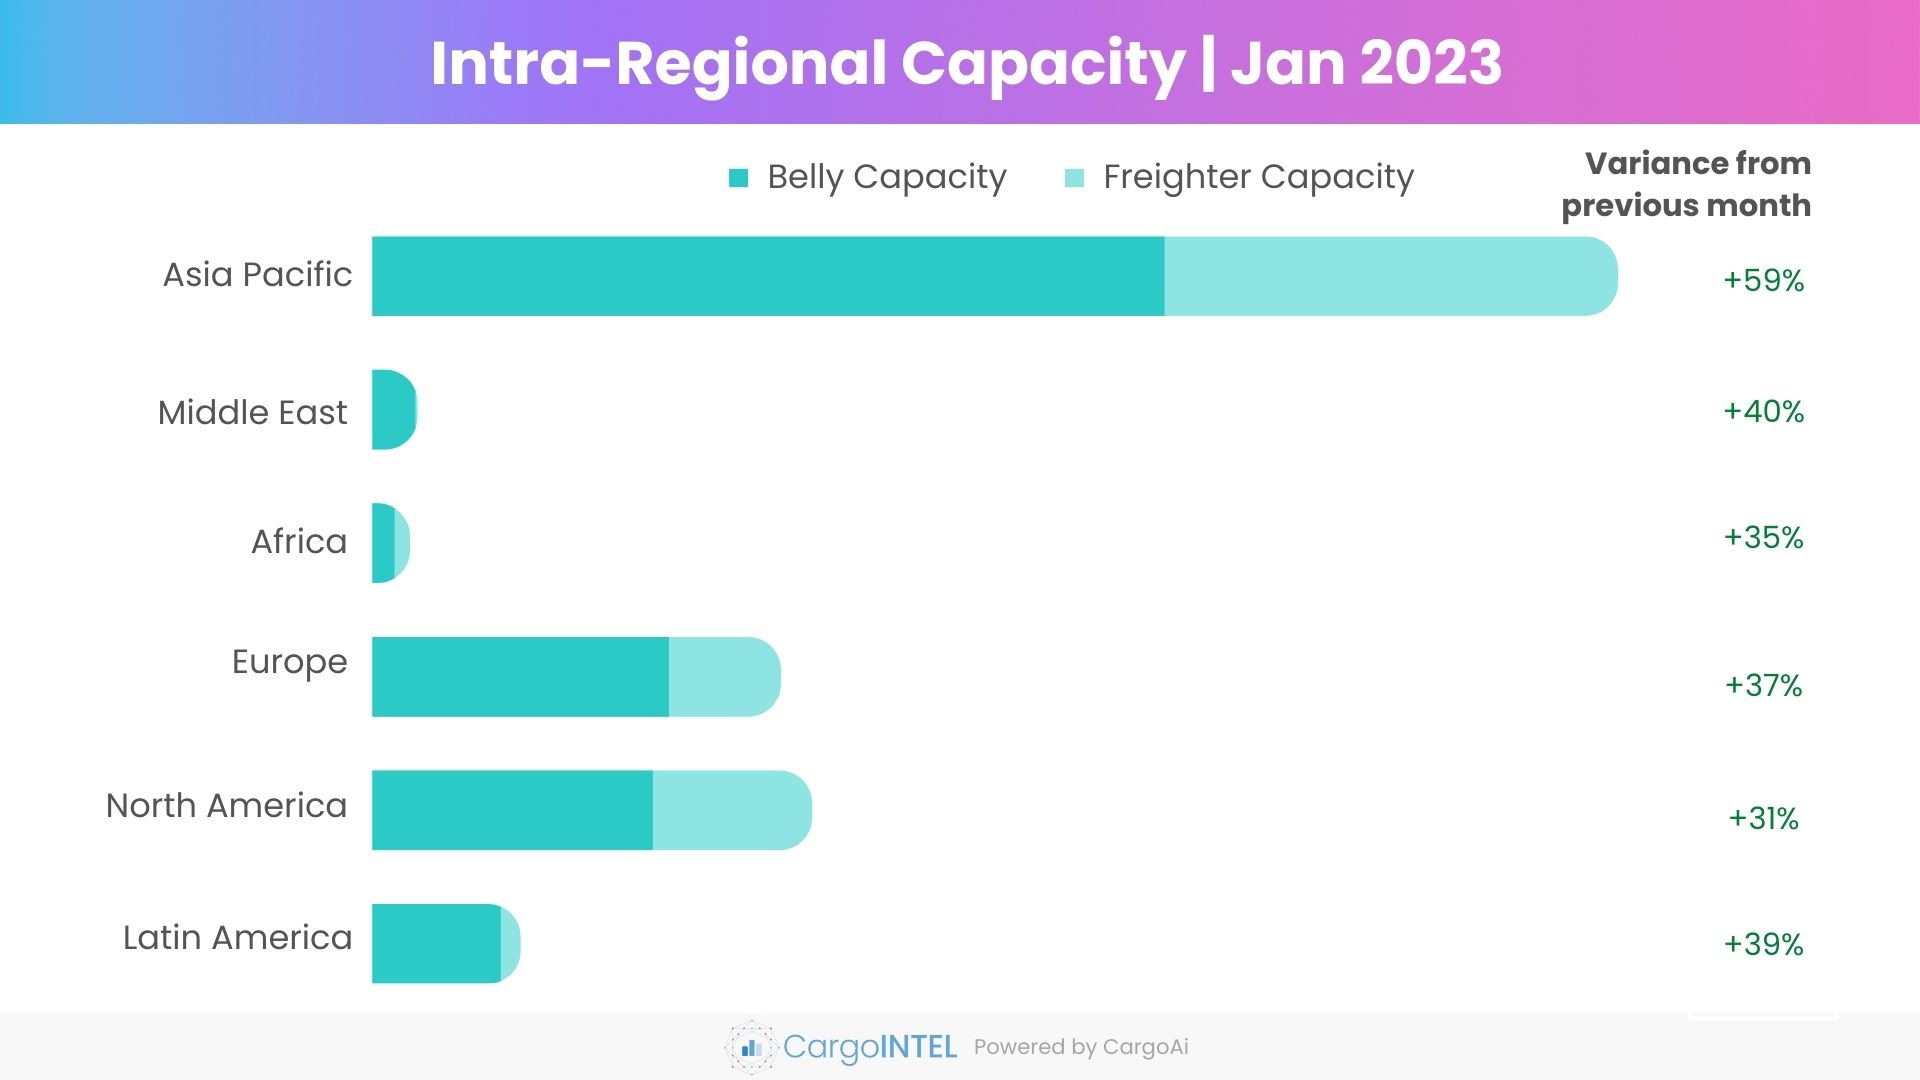
Top Intra-Regional Cargo Capacity
| Region | Capacity in Jan 2023 (100k tons) | Variance vis-a-vis Jan 2023 |
|---|---|---|
| Asia & Pacific | 2563.2 | 59% |
| Middle East | 92.1 | 40% |
| Africa | 76.5 | 35% |
| Europe | 840.1 | 37% |
| North America | 904.5 | 31% |
| Latin America | 304.2 | 39% |
Observations
- The highest month-on-month growth in overall intra-regional capacity is observed within the Asia Pacific region by 59% in January 2023 which was recorded at 2563K MT as compared to 1608K MT in December. This is higher than the monthly intra-regional capacity recorded during October-December.
- This increase majorly driven by a 69% MoM surge in belly capacity to 1630K MT in January, can be attributed to the increased frequencies and additional routes within the region by carriers like China Airlines; China Southern, Indigo, SpiceJet, Thai AirAsia.
- The capacity within Europe which was badly impacted by flight cancellations due to weather conditions and industrial strikes, has rebounded to 840K MT in January an increase by 37%. However the capacity within the region is yet to catch up to the levels in October 2022 by almost 37%.
- As the winter weather conditions continue to hamper the scheduled flight operations in the North America with all regional airlines facing 1-4% cancellation of their flights, the capacity within the region was indexed at 905K MT in January which is only a 31% improvement than in December. The capacity lags by almost 35% from what it was in September-October 2022.
Air Cargo Global chargeable weight analysis
Observations
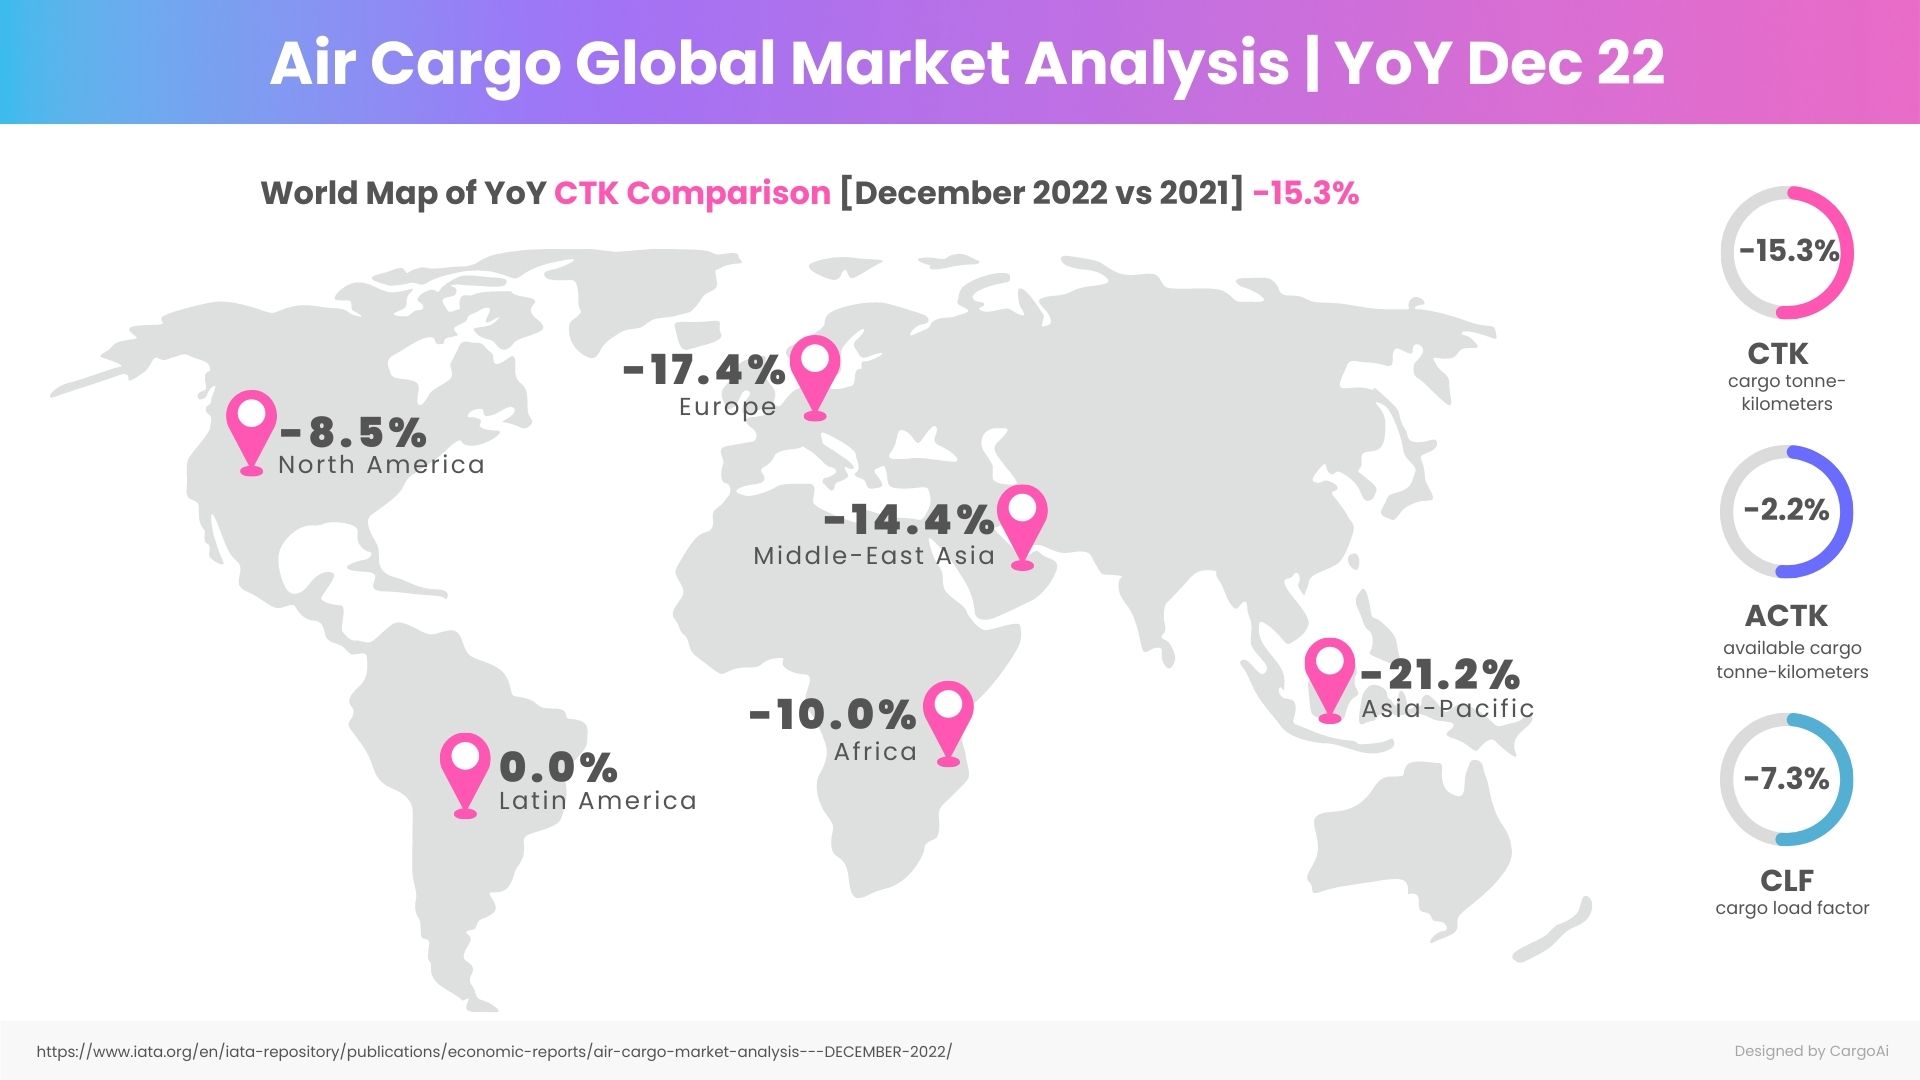
- The air cargo demand, CTK (Cargo Tonne-Kilometres) indexed by IATA in December 2022 remained at 20.6 billion, the same as in November 2022. The demand was down by 15.3% YoY as compared to December 2021, and 7.4% lower than that in the same period in 2019.
- The YTD figures for the whole of year 2022, CTK remained 8% down from 2021, almost 2% lowed than the pre-COVID period in 2019.
- A year-on-year comparison of ACTK (Available Cargo Tonne-Kilometres) shows a slump of 2.2% in December 2022 vis-à-vis December 2021.
- The major reason has been the lack of demand for new export orders in the major economies and inflation in the G7 countries.
- Cargo load factor (CLF) is remains hovering around an all-year low of 47% for yet another month in December.
Resources:
- https://www.worldacd.com
- https://www.iata.org/en/iata-repository/publications/economic-reports/air-cargo-market-analysis---december-2022/
- https://www.eurocontrol.int/sites/default/files/2023-01/eurocontrol-comprehensive-air-traffic-assessment-20230112.pdf
- https://www.euronews.com/travel/2023/01/21/france-italy-and-the-uk-all-of-the-travel-strikes-taking-place-in-europe-in-january-and-fe
- https://www.reuters.com/world/europe/strike-berlin-airport-ground-flights-wednesday-operator-2023-01-23/
- https://www.routesonline.com/news/29/breaking-news/299297/ethiopian-airlines-explores-malta-potential/
- https://www.ups.com/ar/en/supplychain/insights/news-and-market-updates/market-update-january-12-2023.page
- https://www.stattimes.com/air-cargo/with-a-peak-that-wasnt-air-cargo-rides-into-2023-1347758
- https://www.reuters.com/world/us/airlines-cancel-over-1400-us-flights-ice-storm-hits-multiple-states-2023-02-01/
- https://www.forbes.com/advisor/travel-insurance/us-flight-cancellations-last-week-2-6-2023/
RECENT POSTS