
Capacity Statistics - April 2023
CargoAi features the air cargo capacity statistics report for April 2023 extracted from the business intelligence tool CargoINTEL using the real-time facts and figures. Read on for the most significant insights and analysis of inter-regional and intra-regional capacity in comparison to the previous month.
Highlights
- CargoINTEL has observed a consistency and stability in global capacity in April 2023 level pegging with that of March 2023, flagging a constructive start to Q2 of 2023 in terms of supply.
- The overall global capacity registered in April by CargoINTEL is 2949K MT, 1% growth month-on-month as compared to 2906K MT in March.
- There is no significant change recorded in the global belly capacity, which looms around 1586K MT both in April and March. This indicates the steadiness of the scheduled operation of flights worldwide in the summer schedule.
- The overall global freighter capacity has marginally increased in April by 3% to 1363K MT from 1320K MT in March.
- The most notable evolution in capacity is observed between Europe and North America regions with double digit growth, owing to the normalizing flight schedules after a frenzied few months of flight delays and cancellations.
- The stability in capacity resonates to the steadying global tonnages in April, as reiterated by WorldACD. However, a year-on-year comparison shows a lag by 10%.
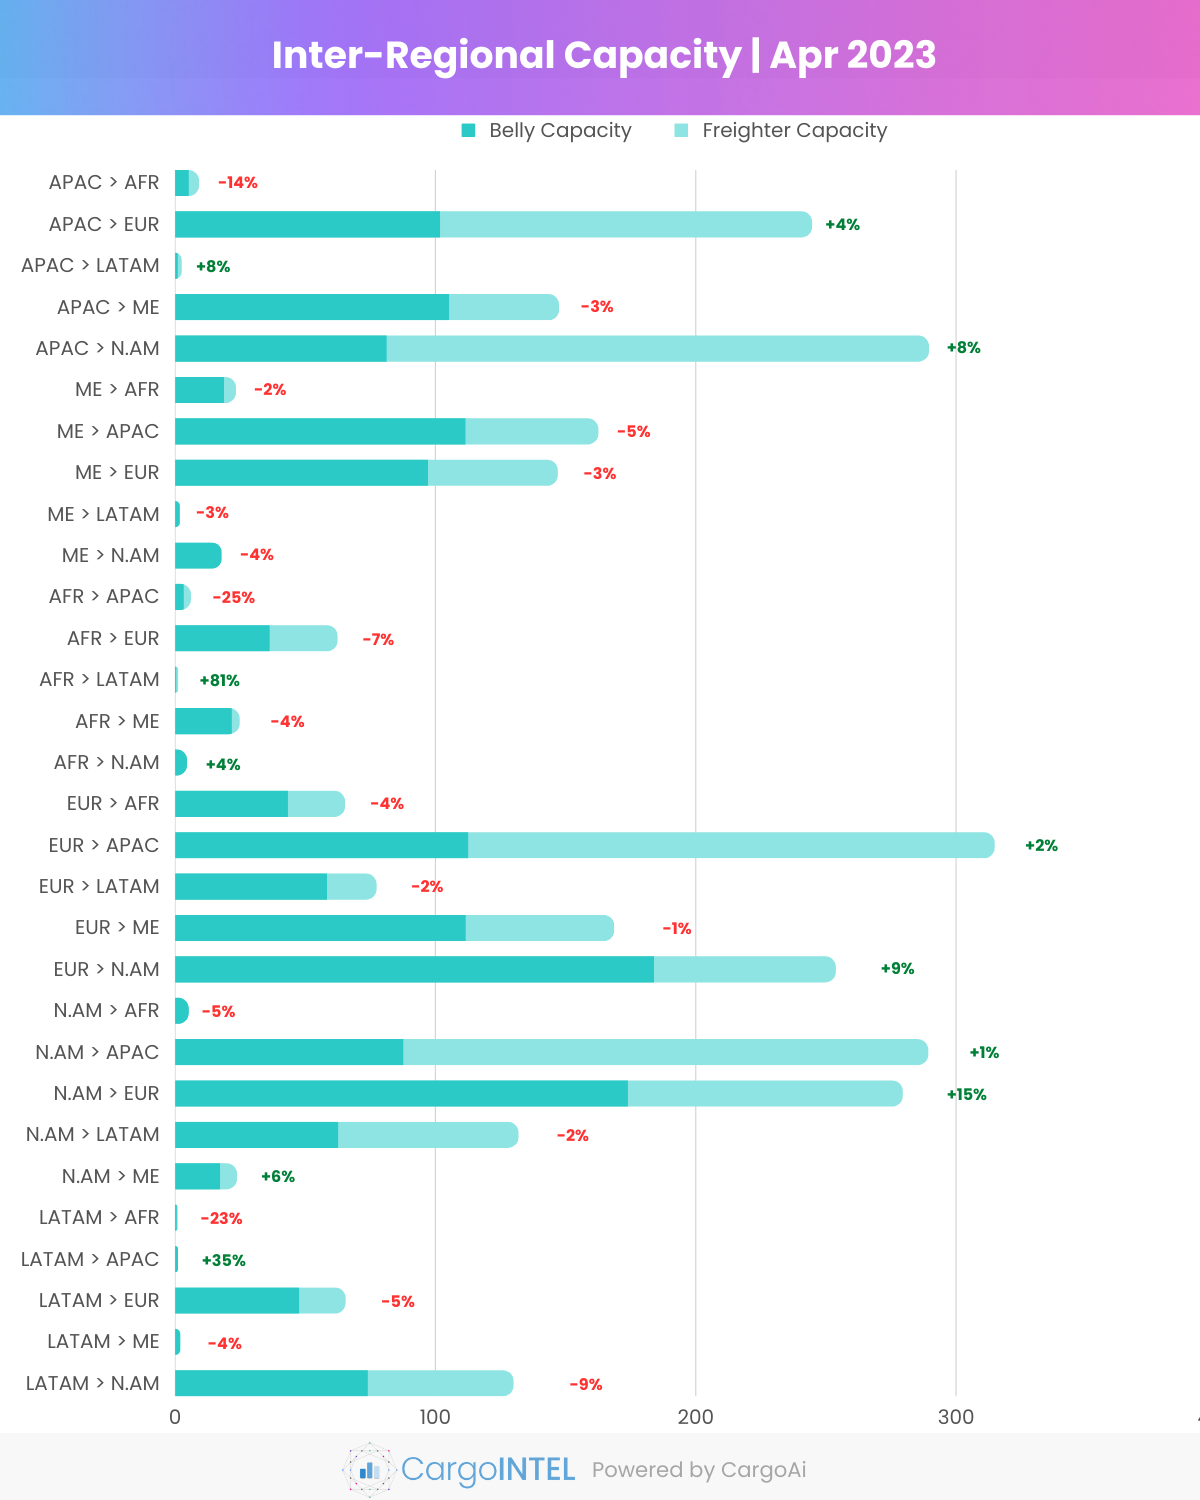
Top Inter-Regional Cargo Capacity
Asia Pacific Region
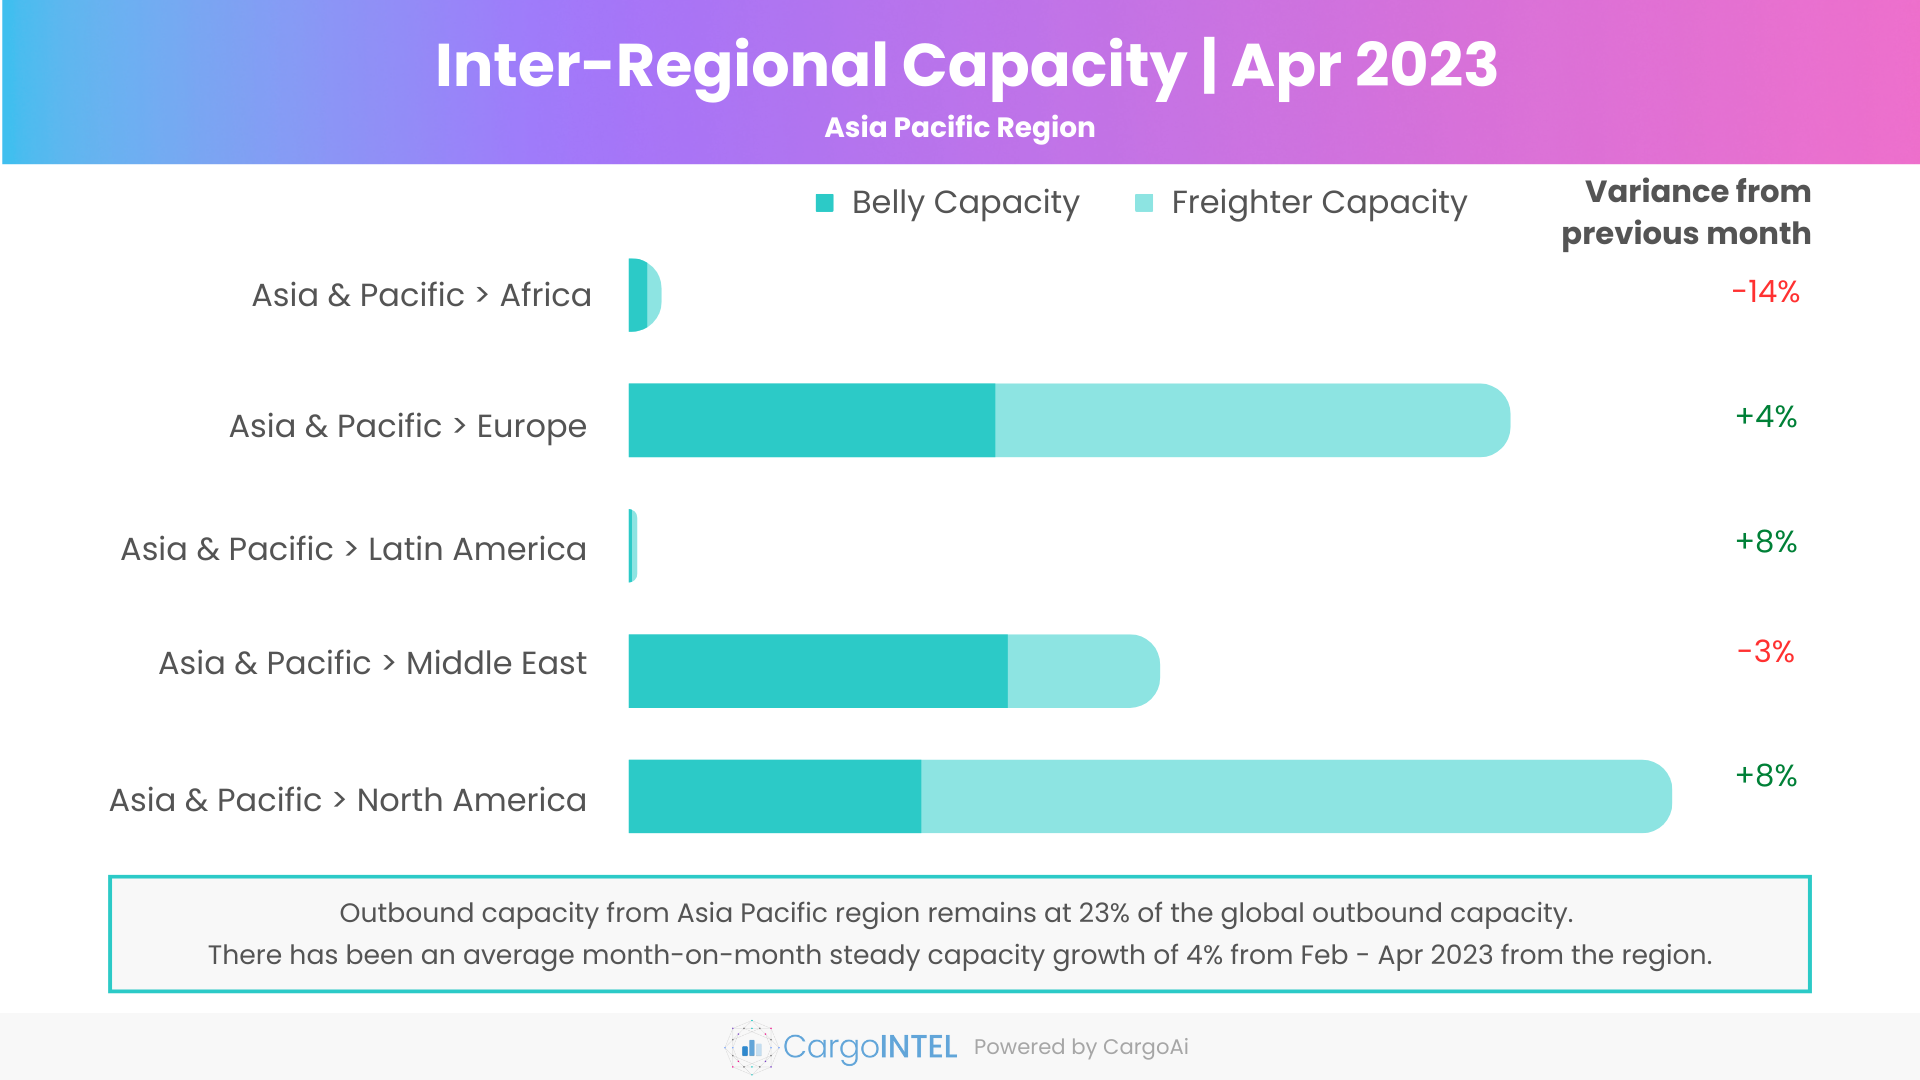
| Region | Capacity in Apr 2023 (100k tons) | Variance vis-a-vis Apr 2023 |
|---|---|---|
Asia & Pacific Africa Africa | 9 | -14% |
| Asia & PacificEurope | 244.5 | 4% |
| Asia & PacificLatin America | 2.3 | 8% |
| Asia & PacificMiddle East | 147.3 | -3% |
| Asia & PacificNorth America | 289.4 | 8% |
Observations
- The overall outbound capacity from Asia Pacific region in April showed a slight spike of 4% at 693K MT as compared to 668K MT in March.
- There has been no major change in the belly capacity recorded in both March and April, stably lurking around 295K MT.
- The overall freighter cargo capacity from the Asia Pacific region has increased resolutely by 7% to almost 400K MT in April from 371K MT in March, marked by a sturdy hike to the high-demand regions, +3% from Asia Pacific to Europe and +11% from Asia Pacific to North America.
- The increase in freighter capacity is attributed to addition of freighter routes by air carriers majorly from China to Europe and North America by Maersk, increase in freighter routes by Japanese All Nippon Airways from Asia to North America, and so on. Newer freighter cargo carriers like British One Air commencing operation denotes signs of increasing demand between the regions.
Middle East Region
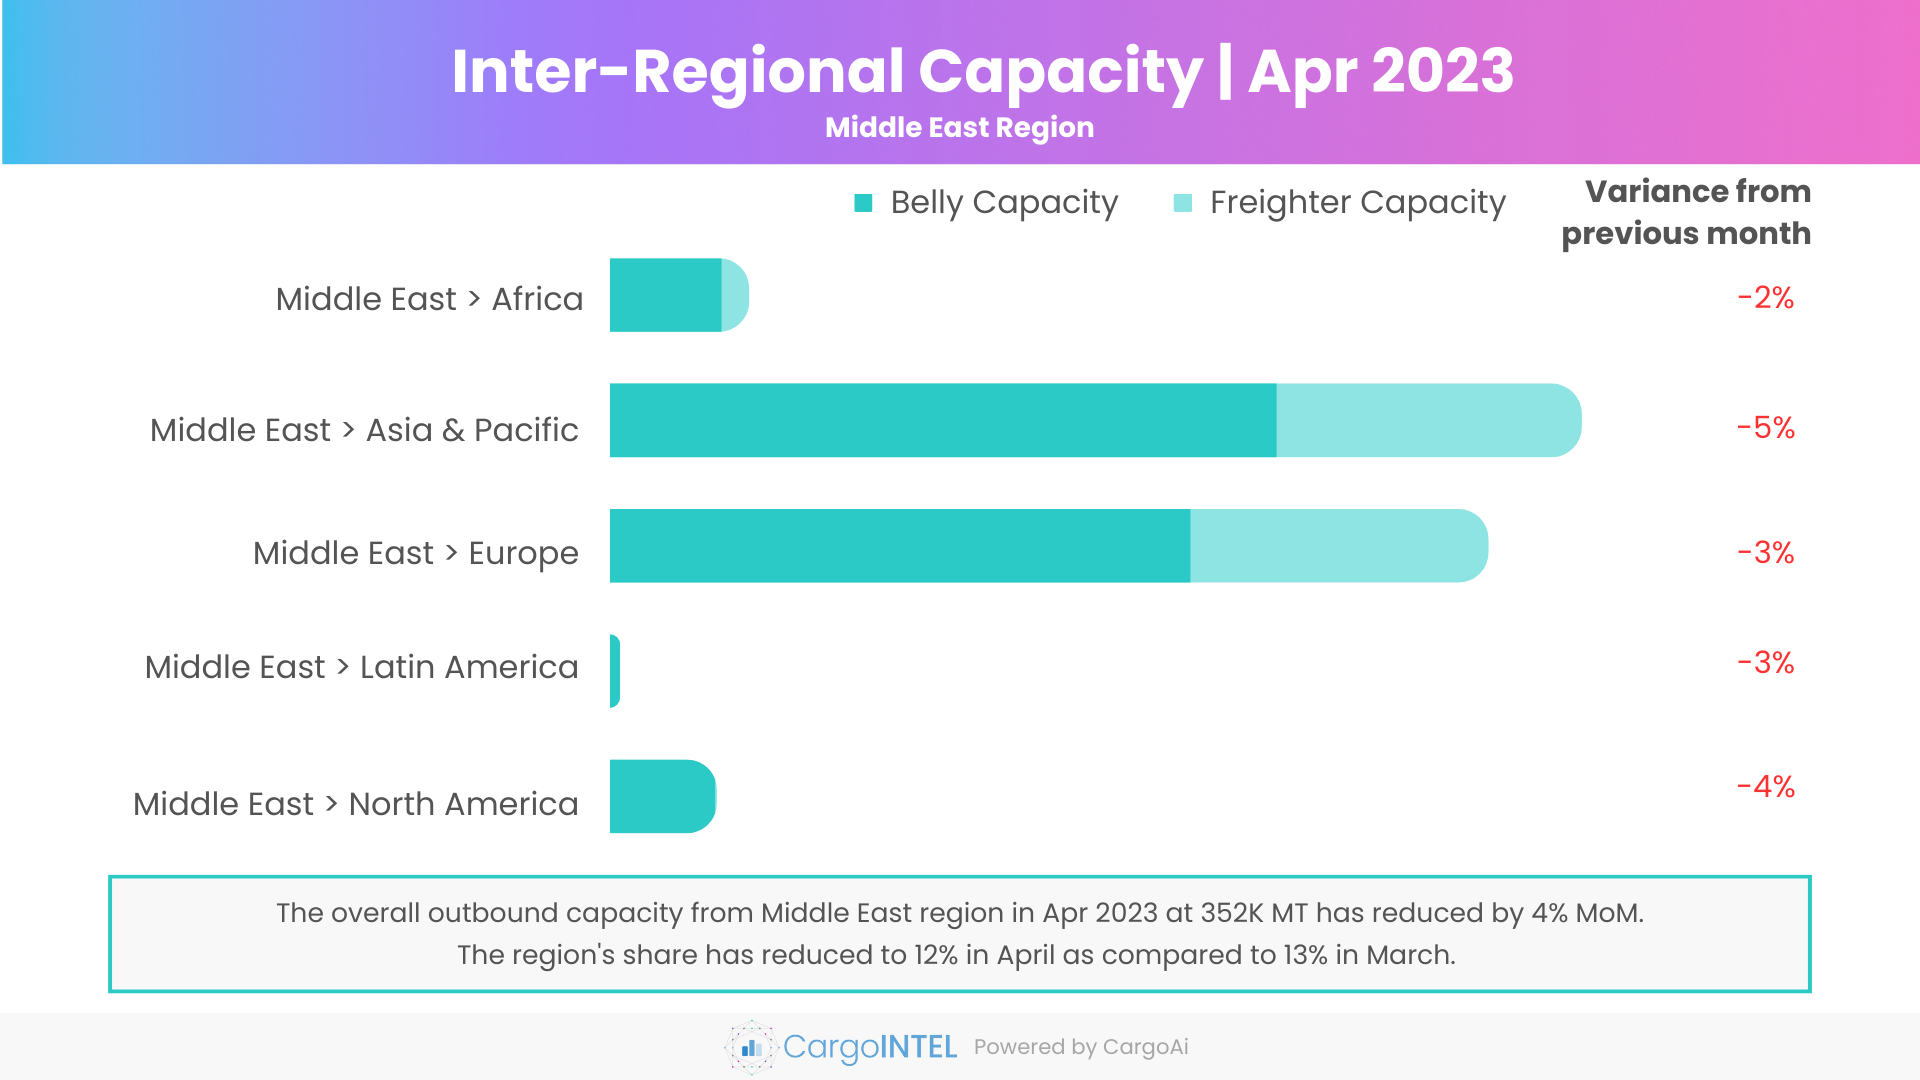
| Region | Capacity in Apr 2023 (100k tons) | Variance vis-a-vis Apr 2023 |
|---|---|---|
| Middle EastAfrica | 23.2 | -2% |
| Middle EastAsia & Pacific | 162.4 | -5% |
| Middle EastEurope | 146.8 | -3% |
| Middle EastLatin America | 1.6 | -3% |
| Middle EastNorth America | 17.8 | -4% |
Observations
- A minor month-on-month reduction in overall outbound capacity by 4% was indexed from the Middle East region in April. The recorded capacity being 352K MT as compared to 366K MT in March.
- There was a reduction of 4% in belly capacity from the region to 246K MT in April as compared to 255K MT in March. Airlines like Middle East Airlines and Fly Dubai reportedly cancelled some of their flights to Europe and Africa, mainly to Sudan. Air India also cancellled flights to Middle-East due to aircraft and crew shortage.
- The freighter capacity from Middle East region also fell by 5% to 106K MT in April as compared to 111K MT in March.
Africa Region
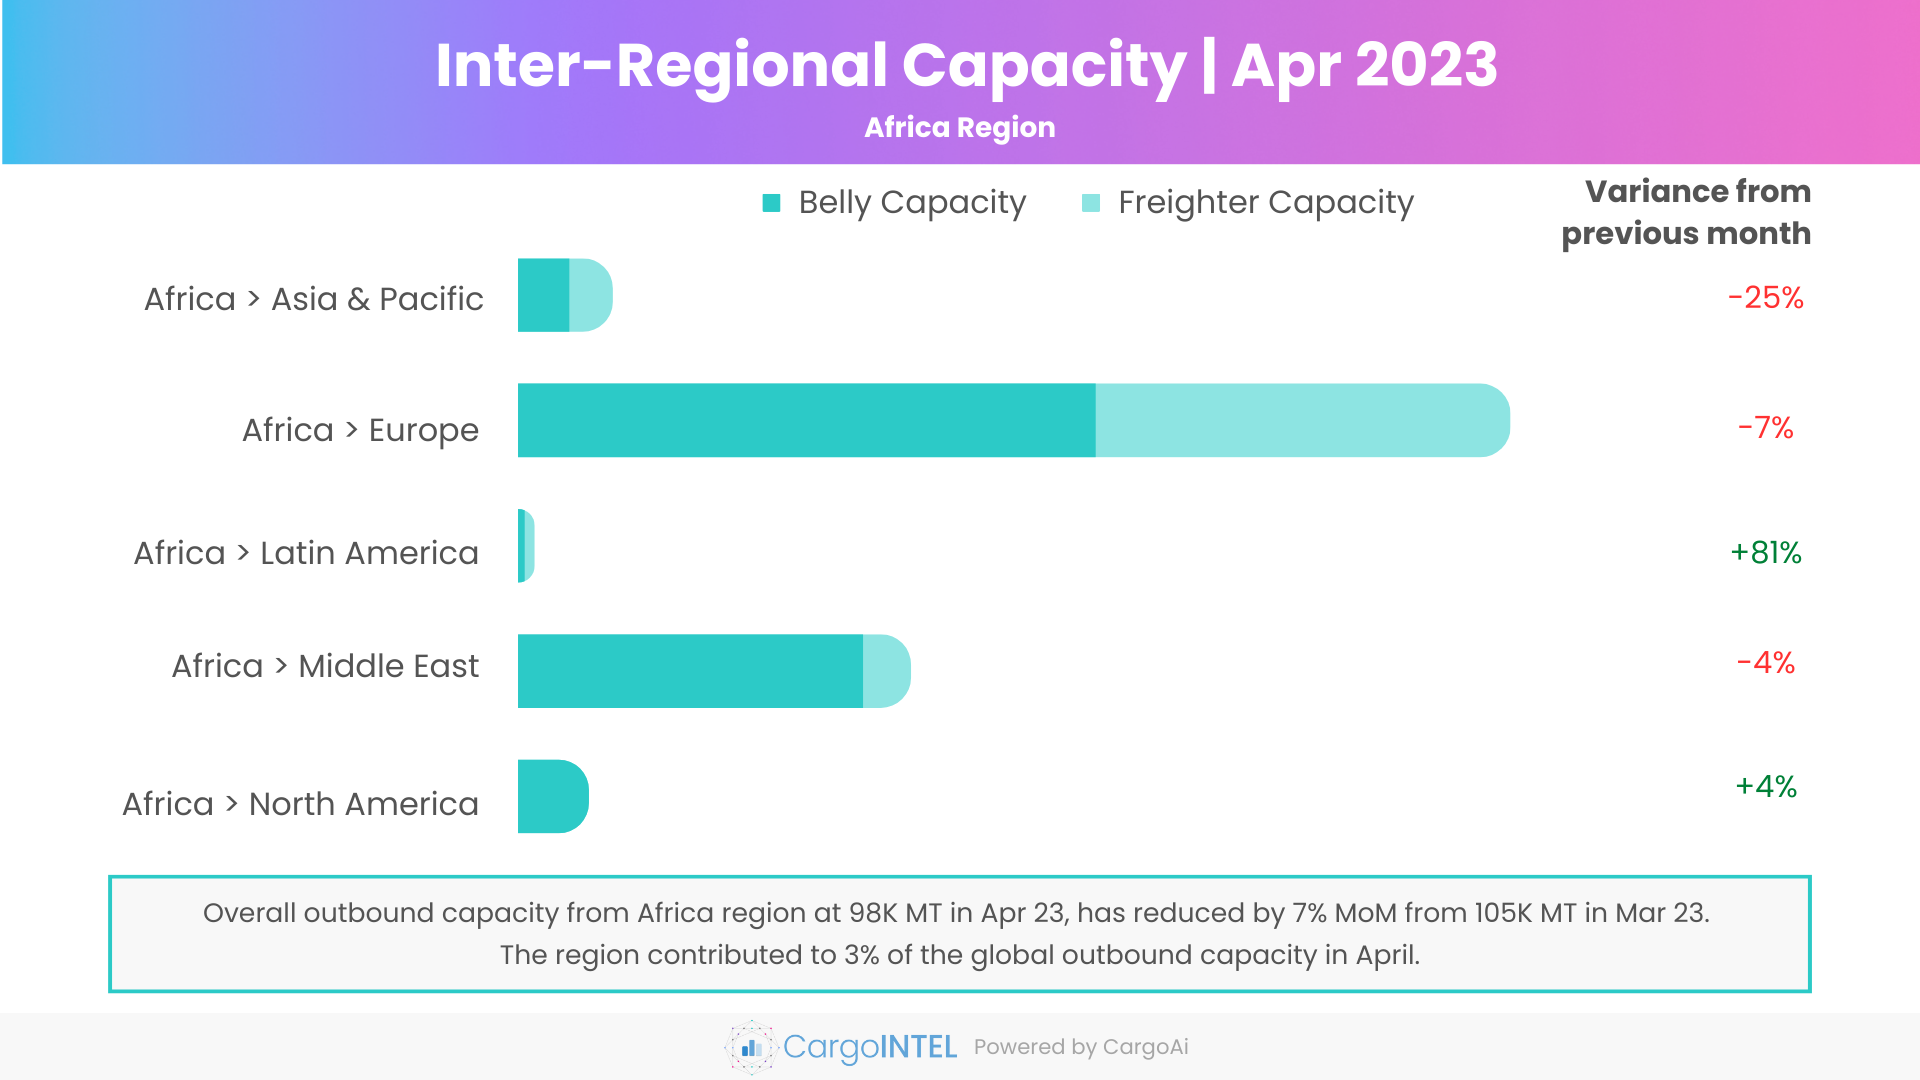
| Region | Capacity in Apr 2023 (100k tons) | Variance vis-a-vis Apr 2023 |
|---|---|---|
| AfricaAsia & Pacific | 5.9 | -25% |
| AfricaEurope | 62.1 | -7% |
| AfricaLatin America | 1 | 81% |
| AfricaMiddle East | 24.6 | -4% |
| AfricaNorth America | 4.4 | 4% |
Observations
- The outbound capacity from Africa region also showed a drop by 7% to 98K MT in April from 105K MT in March. The weather conditions continue to hamper capacity from the African region. While the weather conditions impacted flight operations from Northern African airports in March, this time some parts of South Africa were affected.
- The major reductions were seen from Africa to Asia Pacific, Europe and Middle-East.
- The new flights and freighter operation by African carriers like Ethiopian Airlines and Airlink into Latin and North American destinations has resulted in an upward curve in terms of capacity to these regions.
Europe Region
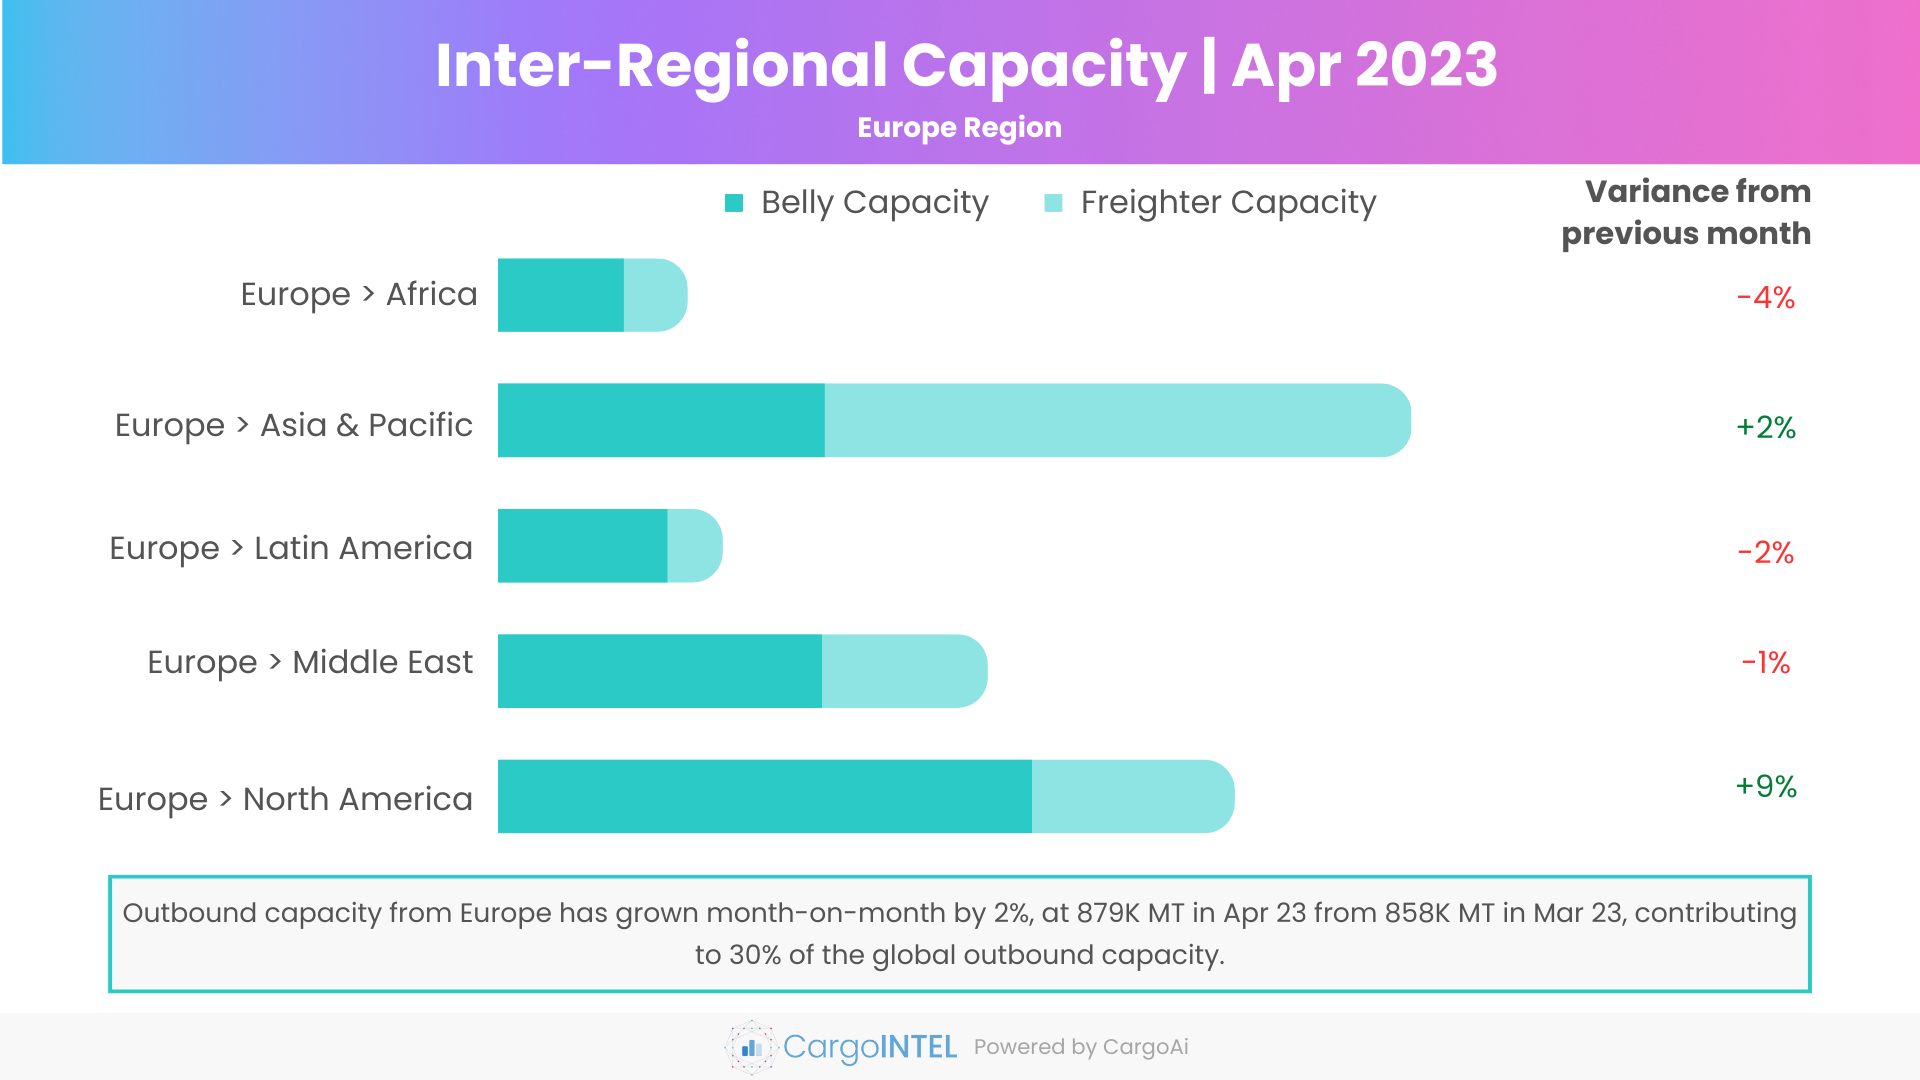
| Region | Capacity in Apr 2023 (100k tons) | Variance vis-a-vis Apr 2023 |
|---|---|---|
| EuropeAfrica | 65.1 | -4% |
| EuropeAsia & Pacific | 314.6 | 2% |
| EuropeLatin America | 77.2 | -2% |
| EuropeMiddle East | 168.5 | -1% |
| EuropeNorth America | 253.6 | 9% |
Observations
- The overall outbound capacity from Europe region has remained steady since January 2023. In April, the outbound capacity has grown month-on-month by 2% to 879K MT from 858K MT in March, signs of reinstating flight operations despite the looming strikes and aftermaths of Russia-Ukraine war.
- While the belly capacity from Europe has increased by 3% to 509K MT in April as compared to 494K MT in March, the freighter capacity surged up by 2% to 370K MT as compared to previous month.
- An overall capacity reduction of 4% was indexed from Europe to Africa, -2% from Europe to Latin America and -1% from Europe to Middle East.
- On the other hand, looking at the capacity from Europe to the two prominent trade regions in April, Europe to Asia Pacific grew by 2% and Europe to North America spiked up by 9% as compared to the previous month.
- Outbound capacity from Europe to North America was registered at 254K MT in April vis-à-vis 232K MT in March. This hike is emphasized by a double-digit 11% increase in belly capacity to 184K MT in April from 166K MT in March.
- The increase in belly capacity are signs of reinstating flights between the two regions also accented by the increase in new routes and frequencies by airlines like SAS, Swiss Air, JetBlue from Europe to North America in the summer schedule.
North America Region
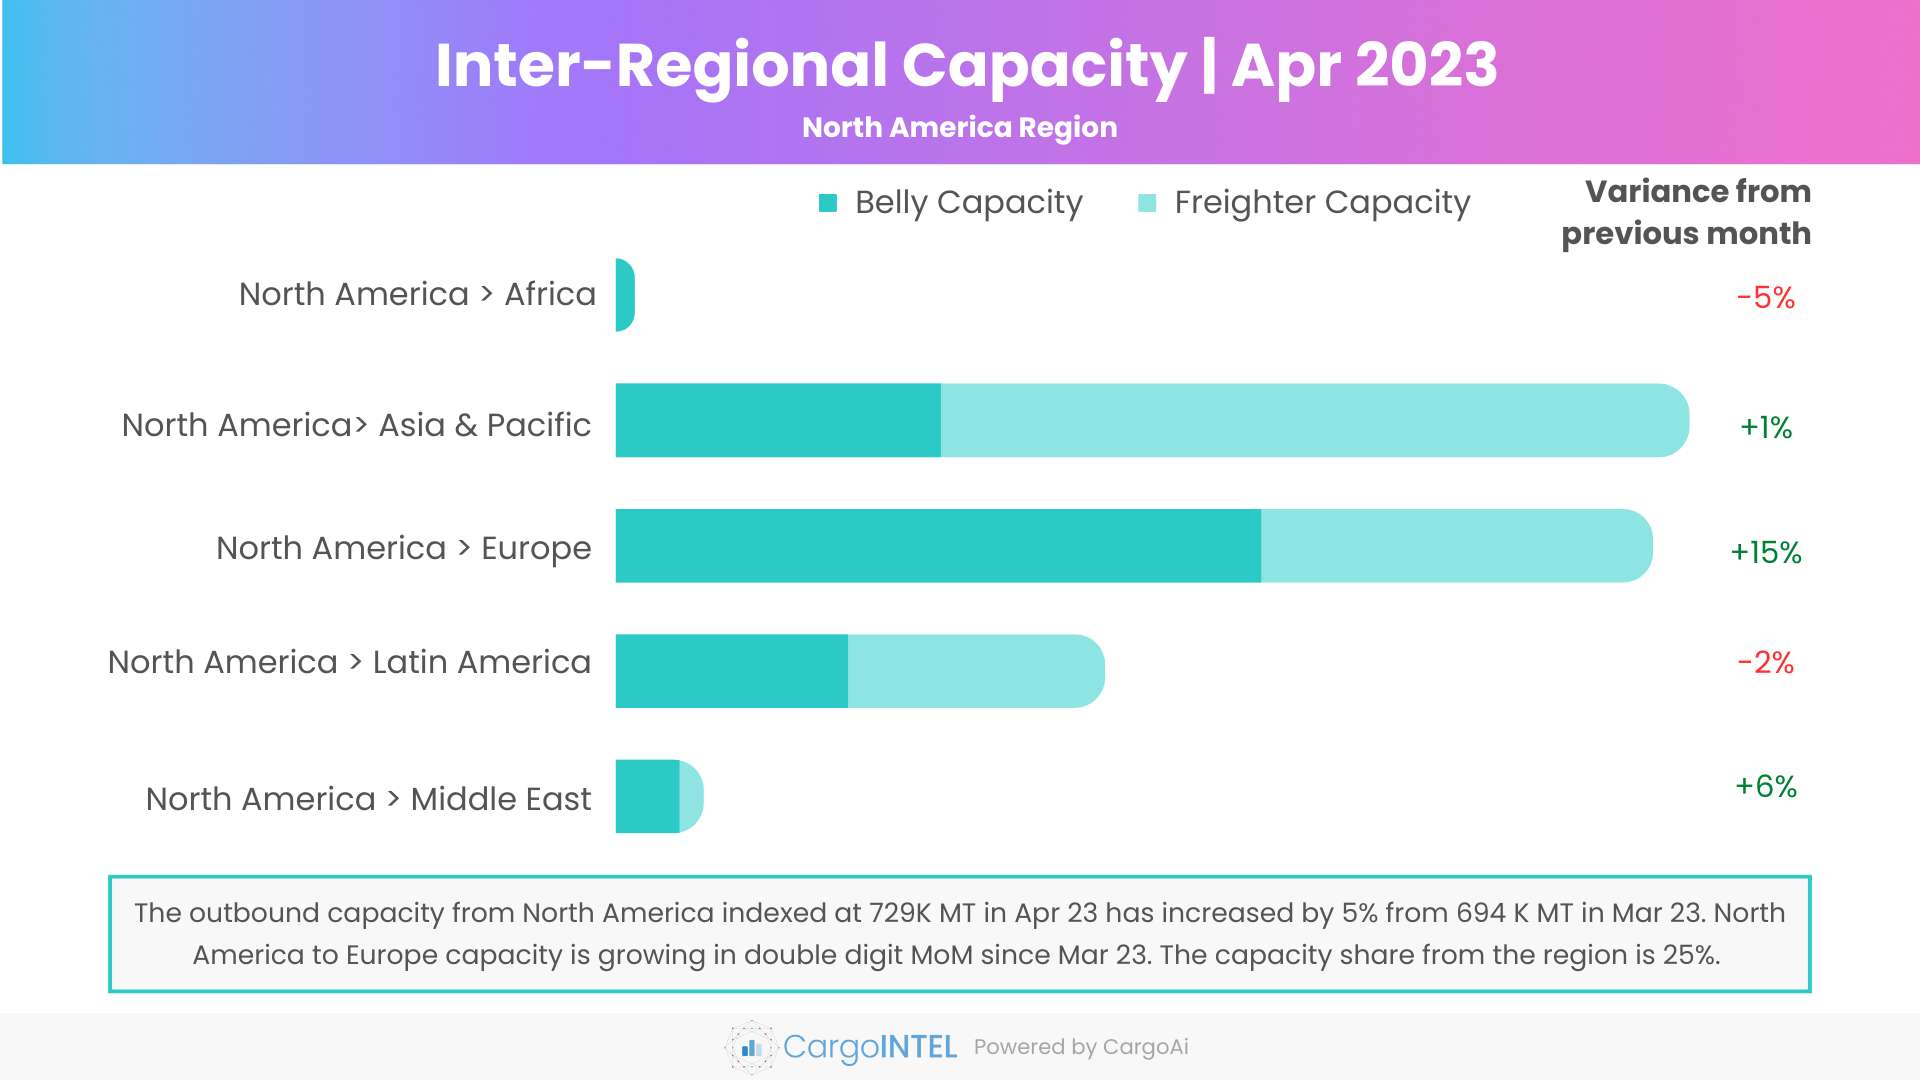
| Region | Capacity in Apr 2023 (100k tons) | Variance vis-a-vis Apr 2023 |
|---|---|---|
| North AmericaAfrica | 5 | -5% |
| North AmericaAsia & Pacific | 289.1 | 1% |
| North AmericaEurope | 279.4 | 15% |
| North AmericaLatin America | 131.7 | -2% |
| North AmericaMiddle East | 23.6 | 6% |
Observations
- The healthy increase in capacity from the North America region since March this year has continued in April with a month-on-month overall outbound capacity growth of 5% from 694K MT in March to 729K MT in April.
- The freighter capacity from the region has increased by 6% to 383K MT in April as compared to 363K MT in March.
- The belly capacity also showed a positive trend since the past two months increasing by 5% in April at 346K MT vis-à-vis 331K MT in March.
- The most striking improvement in capacity was observed from North America to Europe with an increase of 18% month-on-month registered at 174K MT in April. The new transatlantic capacity additions by carriers like American Airlines, Delta, United airlines, Norse Atlantic in the summer schedule are expected to increase the capacity further up between the regions.
- A sound upswing of freighter capacity was also observed from North America to Latin America region, surge by 12% to 69K MT, which may be attributed to the capacity increase by Avianca, Frontier Airlines between the regions.
Latin America Region
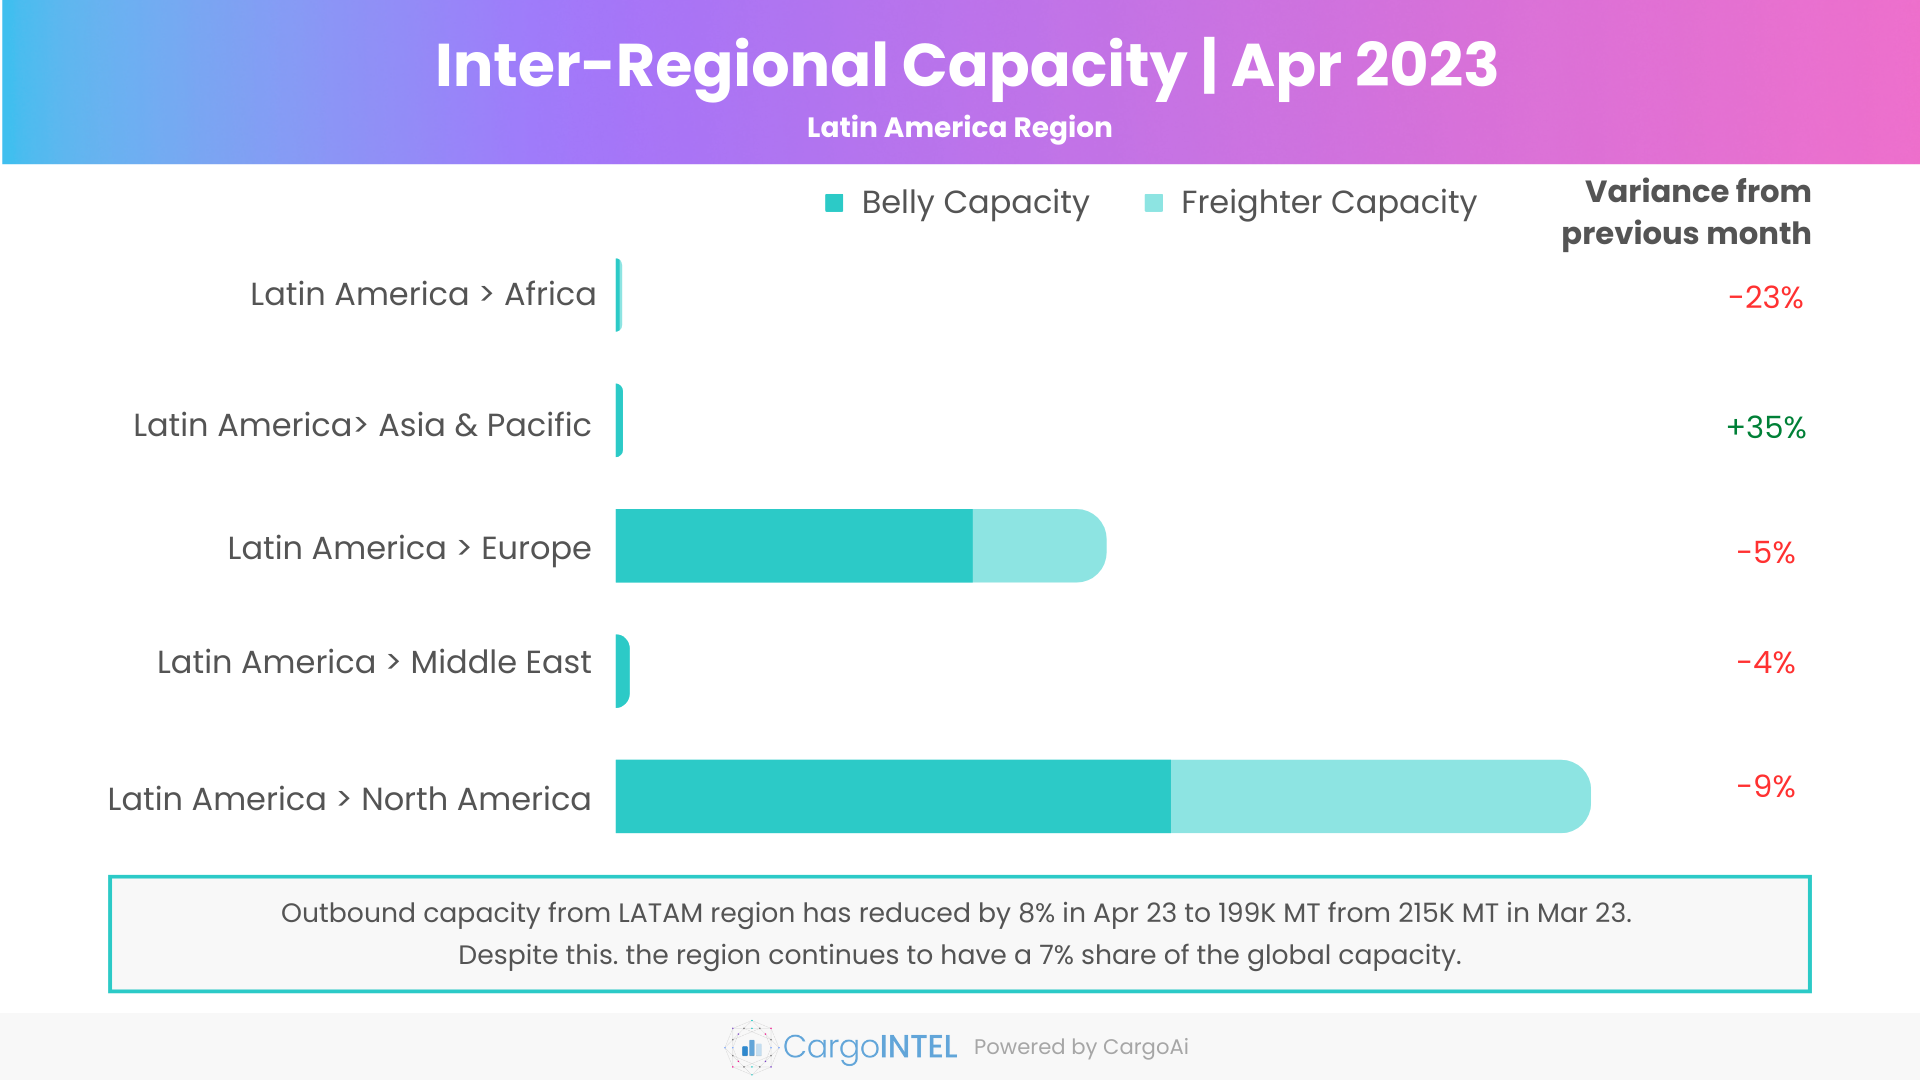
| Region | Capacity in Apr 2023 (100k tons) | Variance vis-a-vis Apr 2023 |
|---|---|---|
| Latin AmericaAfrica | 0.8 | -23% |
| Latin AmericaAsia & Pacific | 0.9 | 35% |
| Latin AmericaEurope | 65.4 | -5% |
| Latin AmericaMiddle East | 1.8 | -4% |
| Latin AmericaNorth America | 129.8 | -9% |
Observations
- Outbound capacity from Latin America region which remained stable since the third quarter of 2022, has showed an overall drop in outbound capacity in April by almost 8%.
- The capacity reduced from 215K MT in March to 199K MT in April.
- While the overall freighter capacity slumped MoM by 6% in April to 74K MT, the belly capacity went down by 9% (124K MT) as compared to March (137K MT).
- An evident dip in belly capacity by 10% was observed from Latin America to North America region.
Top Intra-Regional Cargo Capacity
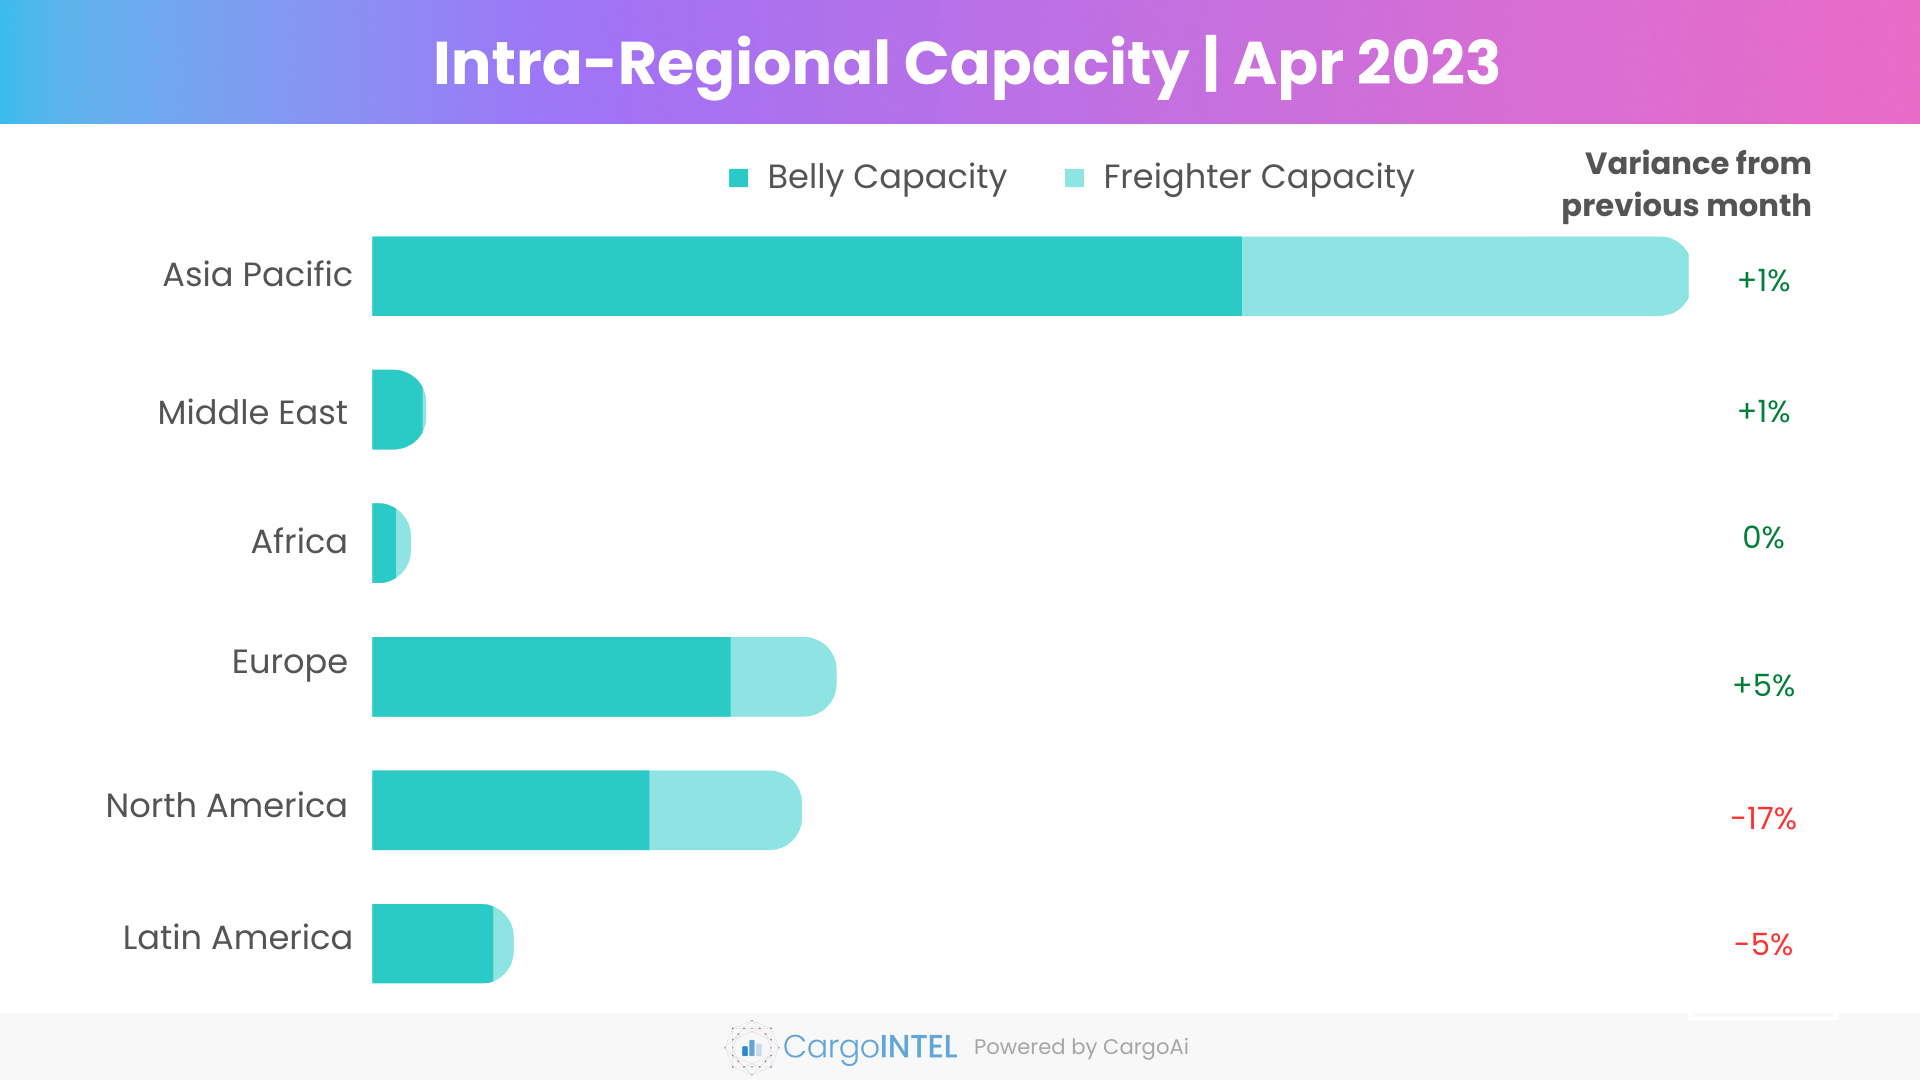
| Region | Capacity in Apr 2023 (100k tons) | Variance vis-a-vis Apr 2023 |
|---|---|---|
| Asia & Pacific | 2716.3 | 1% |
| Middle East | 110.2 | 1% |
| Africa | 78.6 | 0% |
| Europe | 954.8 | 5% |
| North America | 883.7 | -17% |
| Latin America | 290.2 | -5% |
Observations
- The intra Asia Pacific capacity marginally grew by 1% month-on-month to 2716K MT in April. While the freighter capacity remained status quo as compared to the previous month, a 2% MoM increase in belly freight capacity indexed at 1790K MT is characterized by the new belly capacity additions by carriers like Air Asia, Vietjet, Qantas, Cambodia Airways.
- The intra regional capacity within Middle East and Africa have remained steady throughout March-April.
- The overall capacity within Europe has increased by 5% in April to 955K MT from 911K MT in March. The belly freight capacity within the region marks a double digit spike of 10% with the new routes and reinstated flights operation by carriers like Austrian Airlines, British Airways, Lufthansa, Condor, Aer Lingus, Air Serbia, and other smaller airlines.
- The intra North America capacity has reduced substantially by 17% from 1070K MT in March to 884K MT in April. The flight cancellations throughout April due to weather conditions could be the major reason.
Air Cargo Global chargeable weight analysis
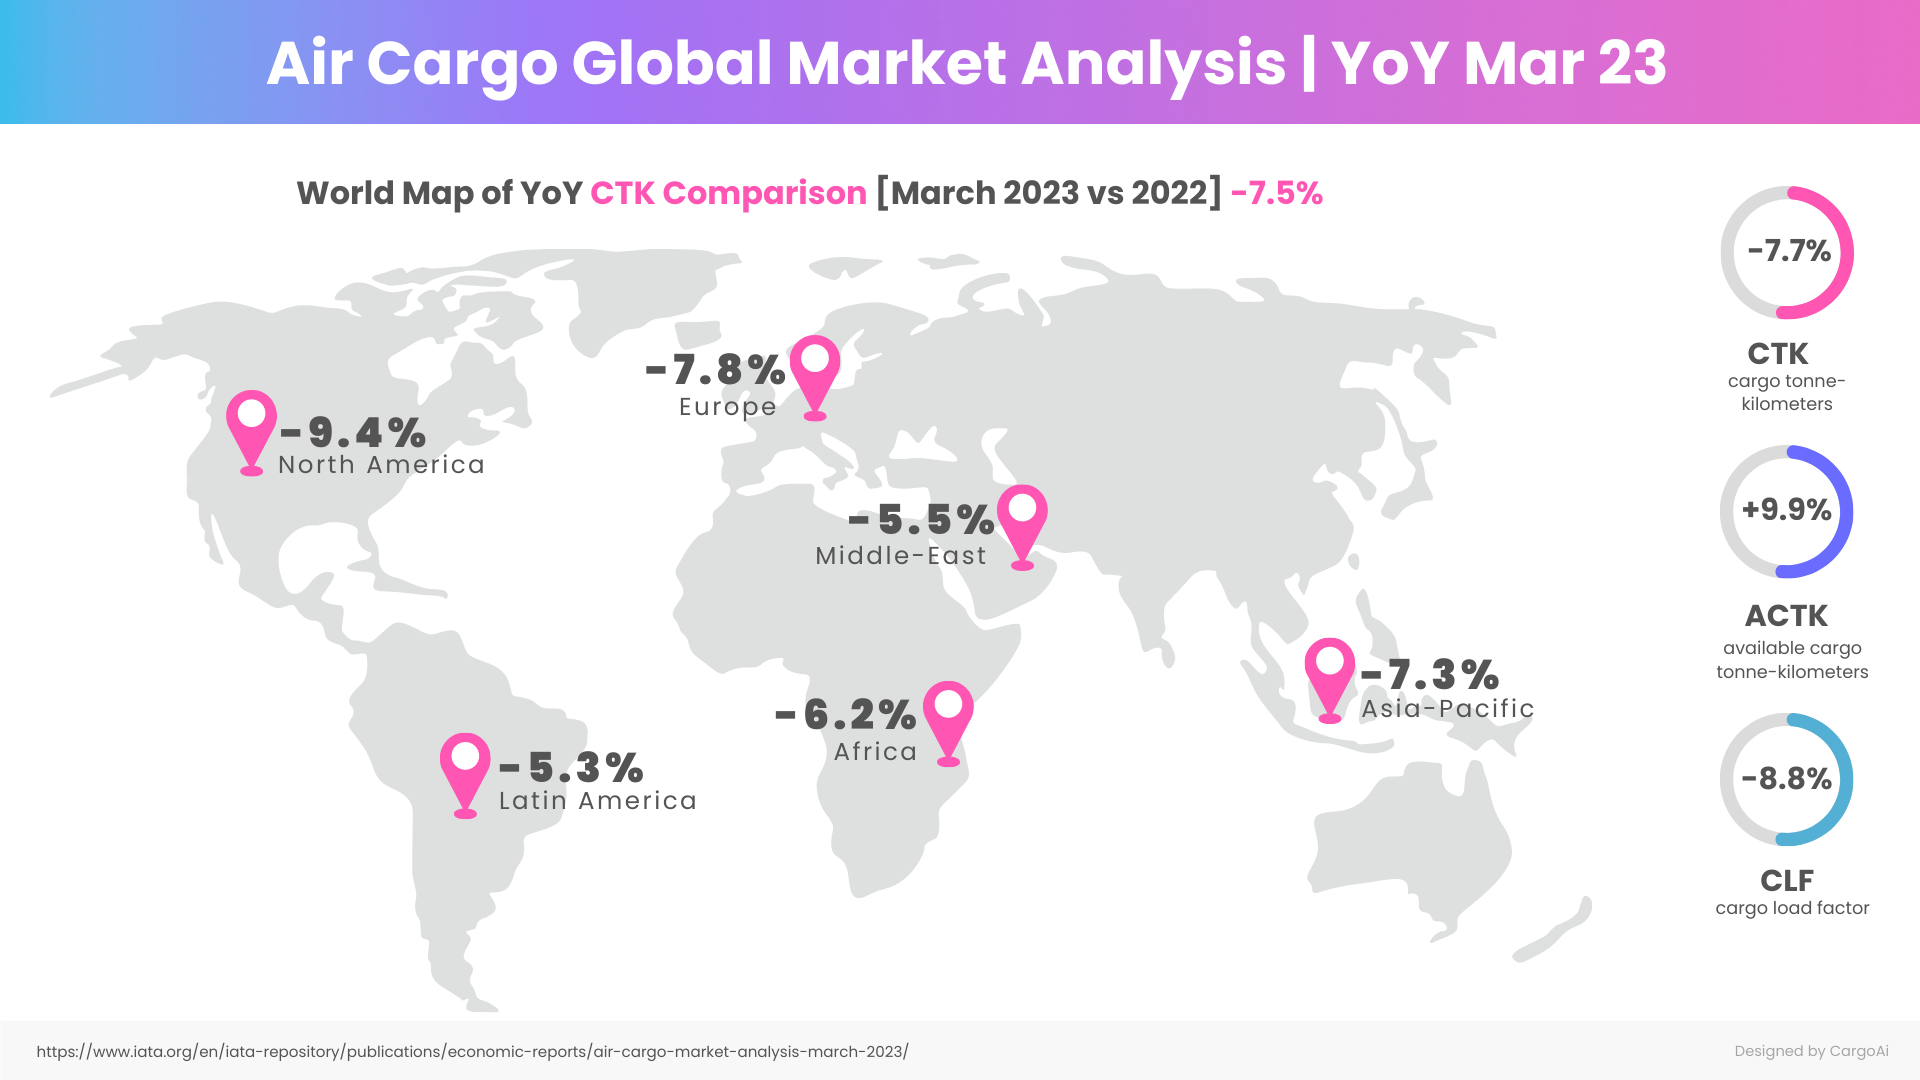
Observations
- The air cargo demand, CTK (Cargo Tonne-Kilometres) in March 2023 fell by 7.7% YoY. However, the reduction was slower in March as compared to the double-digit drop in January and February 2023.
- The available capacity in ACTK (Available Cargo Tonne-Kilometres) in March 2023 grew by a healthy 9.9% YoY, attributed to the increasing belly capacity.
- Consequently, with the increased capacity and an unmatched demand, the cargo load factor (CLF) dropped to 46.2% in March, a drop of 8.8% as compared to the same period previous year.
Resources:
- https://www.worldacd.com
- https://www.iata.org/en/iata-repository/publications/economic-reports/air-cargo-market-analysis-march-2023/
- https://www.mordorintelligence.com/industry-reports/asia-pacific-freighter-aircraft-market
- https://www.argusmedia.com/en/news/2426268-japans-ana-to-increase-cargo-freighter-capacity
- https://www.maersk.com/news/articles/2023/04/04/maersk-launches-new-us-china-air-cargo-link
- https://www.zawya.com/en/business/aviation/dubai-airline-announces-flight-cancellations-to-sudan-amid-ongoing-conflict-iz6y7381
- https://crisis24.garda.com/alerts/2023/04/south-africa-ongoing-flight-disruptions-affecting-cape-town-international-airport-as-of-early-april-18
- https://www.routesonline.com/news/29/breaking-news/299561/routes-in-brief-rolling-daily-updates-wc-april-11-2023/
- https://airspace-africa.com/2023/02/16/ethiopian-airlines-broadens-its-horizon-with-new-cargo-routes-to-china-and-south-america-balkan-region-on-its-radar/
- https://aviationsourcenews.com/airline/air-india-reduces-middle-east-flights-amidst-aircraft-and-crew-shortages/
- https://payloadasia.com/2023/04/uks-newest-all-cargo-airline-is-one-air/
- https://www.traveloffpath.com/12-new-transatlantic-flights-launching-in-2023/
- https://www.forbes.com/advisor/travel-insurance/us-flight-cancellations-last-week-5-8-2023/
- https://www.usatoday.com/story/travel/airline-news/2023/04/01/canceled-delayed-flight-saturday/11578567002/
- https://aviationweek.com/air-transport/airports-networks/50-new-routes-starting-april-2023
- https://www.routesonline.com/news/29/breaking-news/299605/routes-in-brief-rolling-daily-updates-wc-april-24-2023/
RECENT POSTS